Zooming in Blazor Charts Component
28 Jul 202623 minutes to read
A detailed walkthrough demonstrating how to configure and use zooming and panning in the Blazor Charts is presented in the video below.
Enable zooming
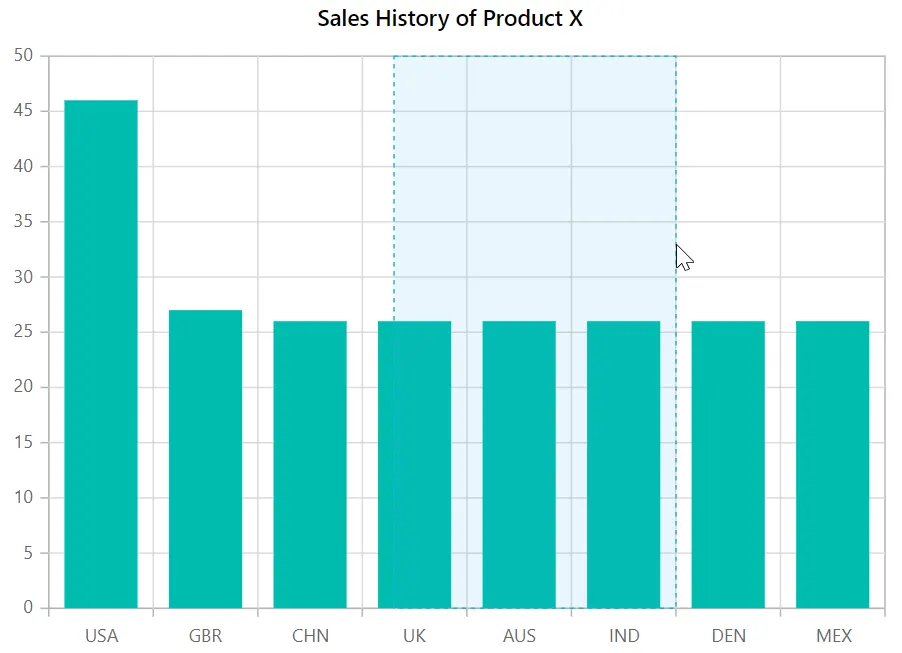
The chart can be zoomed in three different ways.
- Selection - By setting EnableSelectionZooming property to true in ChartZoomSettings, the chart can be zoomed using the rubber band selection.
- Mouse Wheel - By setting EnableMouseWheelZooming property to true in ChartZoomSettings, the chart can be zoomed-in and zoomed-out by scrolling the mouse wheel.
- Pinch - By setting EnablePinchZooming property to true in ChartZoomSettings, the chart can be zoomed through pinch gesture in touch enabled devices.
NOTE
- Pinch zooming is only usable in browsers that support multi-touch gestures.
- To zoom in on a rectangular area on a chart using a touch device, quickly double-tap and then drag your finger to define the zooming area.
@using Syncfusion.Blazor.Charts

<SfChart Title="Sales History of Product X">
    <ChartPrimaryXAxis ValueType="Syncfusion.Blazor.Charts.ValueType.Category"></ChartPrimaryXAxis>

    <ChartZoomSettings EnableMouseWheelZooming="true" EnablePinchZooming="true" EnableSelectionZooming="true"></ChartZoomSettings>

    <ChartSeriesCollection>
        <ChartSeries DataSource="@SalesReports" XName="X" YName="YValue" Type="ChartSeriesType.Column"></ChartSeries>
    </ChartSeriesCollection>
</SfChart>

@code{
    public class ChartData
    {
        public string X { get; set; }
        public double YValue { get; set; }
    }


    public List<ChartData> SalesReports = new List<ChartData>
    {
        new ChartData { X= "USA", YValue= 46 },
        new ChartData { X= "GBR", YValue= 27 },
        new ChartData { X= "CHN", YValue= 26 },
        new ChartData { X= "UK", YValue= 26 },
        new ChartData { X= "AUS", YValue= 26 },
        new ChartData { X= "IND", YValue= 26 },
        new ChartData { X= "DEN", YValue= 26 },
        new ChartData { X= "MEX", YValue= 26 },
    };
}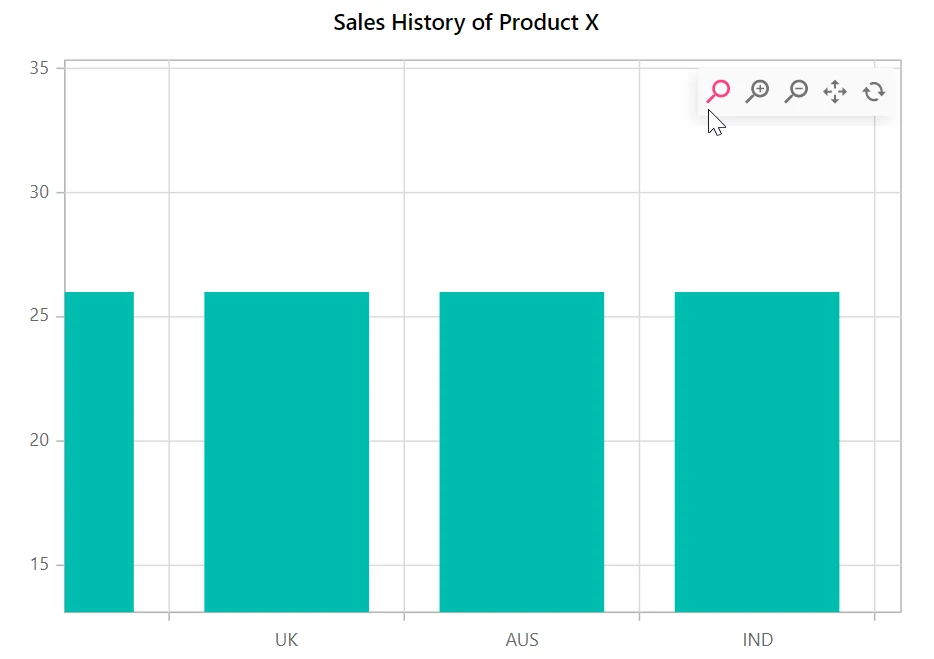
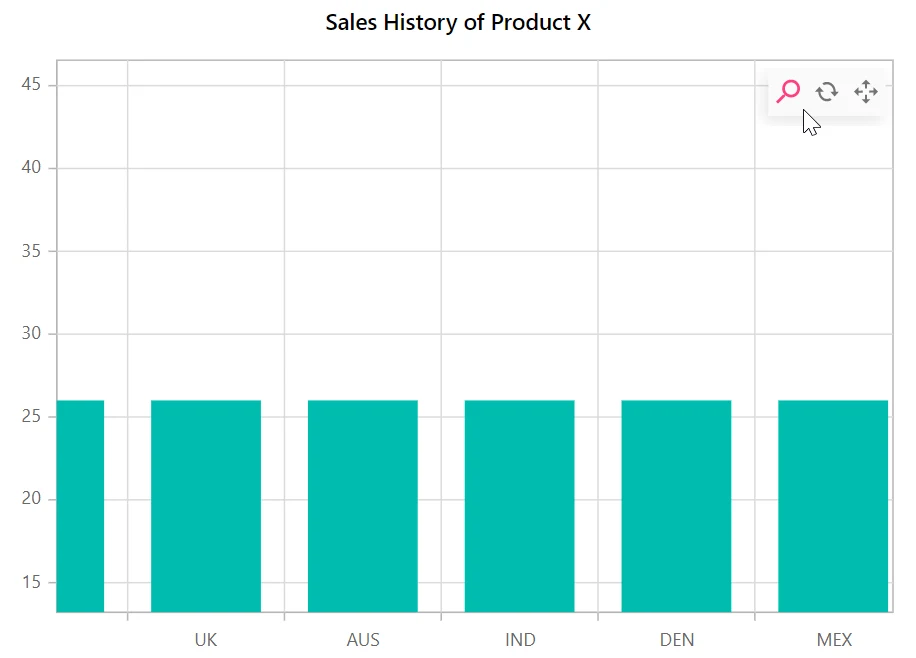
A zooming toolbar will show after zooming the chart, featuring options for Zoom, Zoom In, Zoom Out, Pan, and Reset. The Pan option allows you to pan the chart, while the Reset option allows you to reset the zoomed chart.
Modes
The Mode property in ChartZoomSettings determines whether the chart can scale along the horizontal or vertical axes. The default value of the mode is XY (both axis).
There are three types of modes.
- X - Allows us to zoom the chart horizontally.
- Y - Allows us to zoom the chart vertically.
- XY - Allows us to zoom the chart both vertically and horizontally.
@using Syncfusion.Blazor.Charts

<SfChart Title="Sales History of Product X">
    <ChartPrimaryXAxis ValueType="Syncfusion.Blazor.Charts.ValueType.Category"></ChartPrimaryXAxis>

    <ChartZoomSettings EnableSelectionZooming="true" Mode="ZoomMode.X"></ChartZoomSettings>

    <ChartSeriesCollection>
        <ChartSeries DataSource="@SalesReports" XName="X" YName="YValue" Type="ChartSeriesType.Column"></ChartSeries>
    </ChartSeriesCollection>
</SfChart>

@code{
    public class ChartData
    {
        public string X { get; set; }
        public double YValue { get; set; }
    }

    public List<ChartData> SalesReports = new List<ChartData>
    {
        new ChartData { X= "USA", YValue= 46 },
        new ChartData { X= "GBR", YValue= 27 },
        new ChartData { X= "CHN", YValue= 26 },
        new ChartData { X= "UK", YValue= 26 },
        new ChartData { X= "AUS", YValue= 26 },
        new ChartData { X= "IND", YValue= 26 },
        new ChartData { X= "DEN", YValue= 26 },
        new ChartData { X= "MEX", YValue= 26 },
    };
}
Toolbar
By default, zoom in, zoom out, pan, and reset buttons are available in the toolbar for zoomed charts. The ToolbarItems property specifies which tools should be displayed in the toolbar.
@using Syncfusion.Blazor.Charts

<SfChart  Title="Sales History of Product X">
    <ChartPrimaryXAxis ValueType="Syncfusion.Blazor.Charts.ValueType.Category"></ChartPrimaryXAxis>

    <ChartZoomSettings EnableSelectionZooming="true" EnableMouseWheelZooming="true"
                       EnablePinchZooming="true" ToolbarItems="@ToolbarItem">
    </ChartZoomSettings>

    <ChartSeriesCollection>
        <ChartSeries DataSource="@SalesReports" XName="X" YName="YValue" Type="ChartSeriesType.Column"></ChartSeries>
    </ChartSeriesCollection>
</SfChart>

@code{
    public List<ToolbarItems> ToolbarItem = new List<ToolbarItems>() { ToolbarItems.Zoom, ToolbarItems.Reset, ToolbarItems.Pan };

    public class ChartData
    {
        public string X { get; set; }
        public double YValue { get; set; }
    }

    public List<ChartData> SalesReports = new List<ChartData>
    {
        new ChartData { X= "USA", YValue= 46 },
        new ChartData { X= "GBR", YValue= 27 },
        new ChartData { X= "CHN", YValue= 26 },
        new ChartData { X= "UK", YValue= 26 },
        new ChartData { X= "AUS", YValue= 26 },
        new ChartData { X= "IND", YValue= 26 },
        new ChartData { X= "DEN", YValue= 26 },
        new ChartData { X= "MEX", YValue= 26 },
    };
}
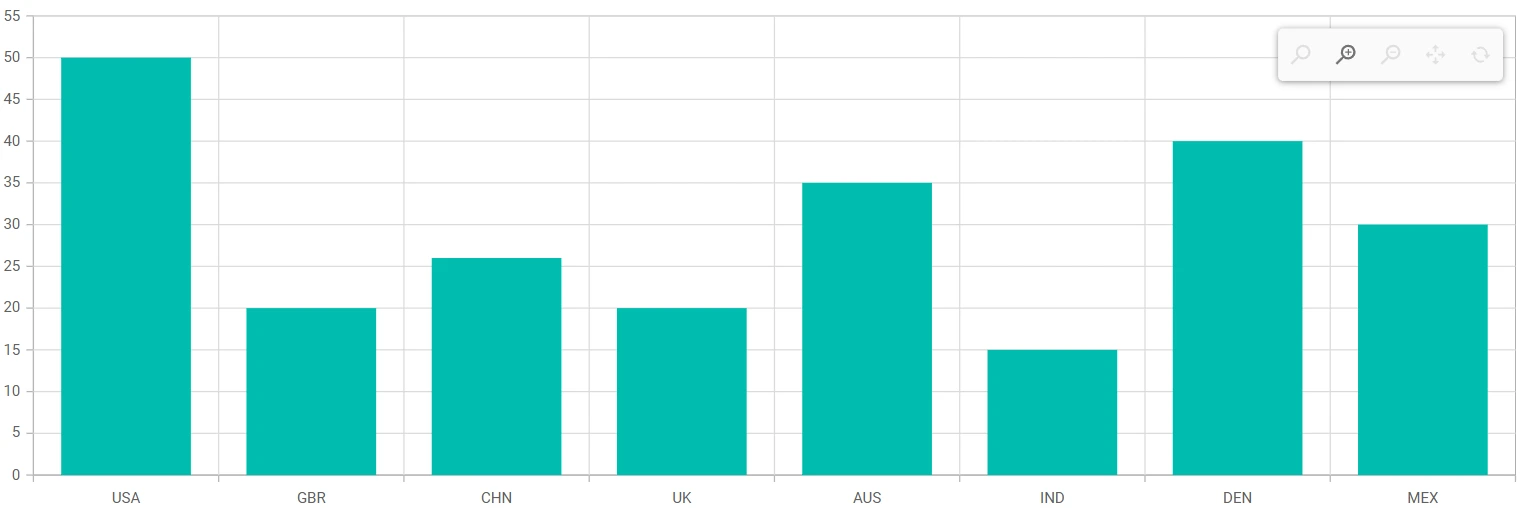
Toolbar display mode
By default, the zooming toolbar appears only when the chart is zoomed. However, you can display a zooming toolbar in the chart during the initial load by setting the ToolbarDisplayMode to ToolbarMode.Always.
@using Syncfusion.Blazor.Charts

<SfChart>
    <ChartPrimaryXAxis ValueType="Syncfusion.Blazor.Charts.ValueType.Category"></ChartPrimaryXAxis>
    <ChartZoomSettings EnableSelectionZooming="true" EnableMouseWheelZooming="true" EnablePinchZooming="true"  ToolbarDisplayMode="ToolbarMode.Always">
    </ChartZoomSettings>
    <ChartSeriesCollection>
        <ChartSeries DataSource="@SalesReports" XName="X" YName="YValue" Type="ChartSeriesType.Column"></ChartSeries>
    </ChartSeriesCollection>
</SfChart>

@code {

    public class ChartData1
    {
        public string X { get; set; }
        public double YValue { get; set; }
    }

    public List<ChartData1> SalesReports = new List<ChartData1>
    {
        new ChartData1 { X= "USA", YValue= 50 },
        new ChartData1 { X= "GBR", YValue= 20 },
        new ChartData1 { X= "CHN", YValue= 26 },
        new ChartData1 { X= "UK", YValue= 20 },
        new ChartData1 { X= "AUS", YValue= 35 },
        new ChartData1 { X= "IND", YValue= 15 },
        new ChartData1 { X= "DEN", YValue= 40 },
        new ChartData1 { X= "MEX", YValue= 30 },
    };
}
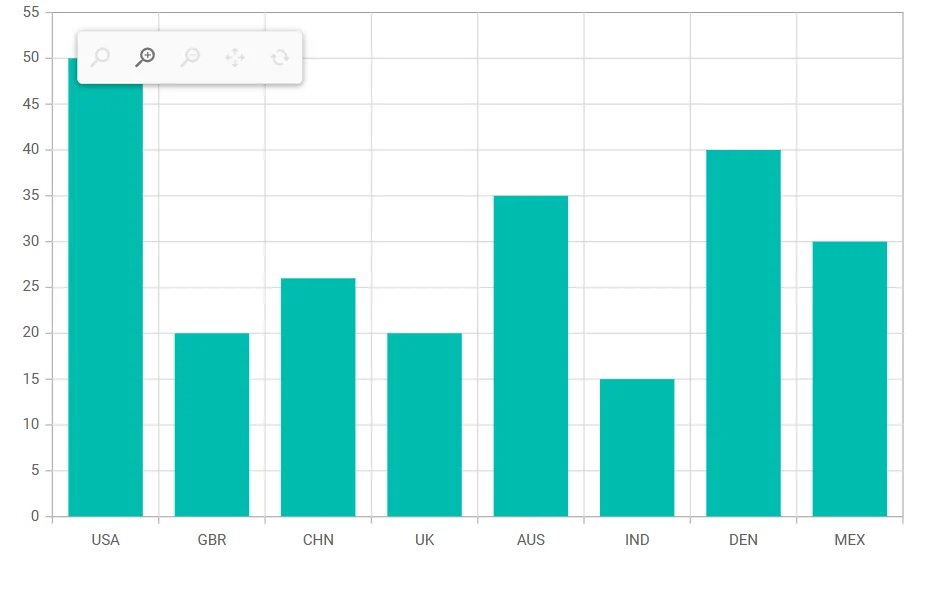
Toolbar positioning
The zoom toolbar in the chart can be repositioned using the ChartZoomToolbarPosition, allowing for flexible alignment and placement. It supports horizontal alignments (Left, Center, and Right) using the HorizontalAlign property, and vertical alignments (Top, Middle, and Bottom) using the VerticalAlign property. By default, HorizontalAlign and VerticalAlign are set to Right and Top respectively. Additionally, for more precise positioning, you can specify custom coordinates using the X and Y properties.
@using Syncfusion.Blazor.Charts

<SfChart>
    <ChartPrimaryXAxis ValueType="Syncfusion.Blazor.Charts.ValueType.Category"></ChartPrimaryXAxis>

    <ChartSeriesCollection>
        <ChartSeries DataSource="@SalesReports" XName="X" YName="YValue" Type="ChartSeriesType.Column"></ChartSeries>
    </ChartSeriesCollection>

    <ChartZoomSettings EnableSelectionZooming="true" EnableMouseWheelZooming="true" EnablePinchZooming="true" ToolbarDisplayMode="ToolbarMode.Always">
        <ChartZoomToolbarPosition HorizontalAlign="Syncfusion.Blazor.Charts.HorizontalAlign.Left" VerticalAlign="Syncfusion.Blazor.Charts.VerticalAlign.Top" X="10" Y="5">
        </ChartZoomToolbarPosition>
    </ChartZoomSettings>
</SfChart>

@code {

    public class ChartData1
    {
        public string X { get; set; }
        public double YValue { get; set; }
    }

    public List<ChartData1> SalesReports = new List<ChartData1>
    {
        new ChartData1 { X= "USA", YValue= 50 },
        new ChartData1 { X= "GBR", YValue= 20 },
        new ChartData1 { X= "CHN", YValue= 26 },
        new ChartData1 { X= "UK", YValue= 20 },
        new ChartData1 { X= "AUS", YValue= 35 },
        new ChartData1 { X= "IND", YValue= 15 },
        new ChartData1 { X= "DEN", YValue= 40 },
        new ChartData1 { X= "MEX", YValue= 30 },
    };
}
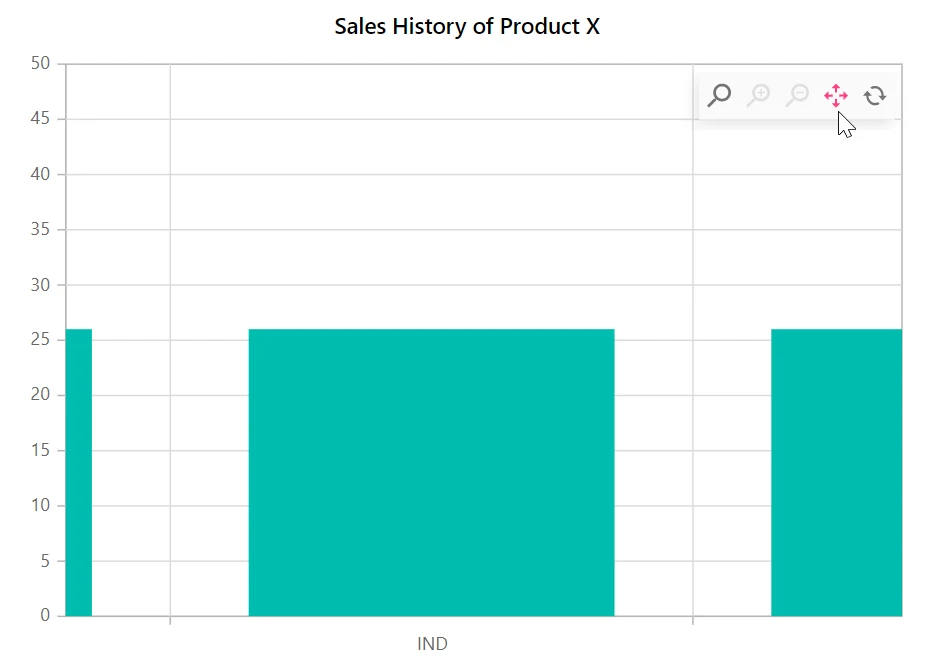
Enable pan
The EnablePan property allows panning of the zoomed chart without using toolbar controls.
@using Syncfusion.Blazor.Charts

<SfChart Title="Sales History of Product X">
    <ChartPrimaryXAxis ValueType="Syncfusion.Blazor.Charts.ValueType.Category" ZoomFactor="0.2" ZoomPosition="0.6"></ChartPrimaryXAxis>

    <ChartZoomSettings EnableSelectionZooming="true" EnablePan="true"></ChartZoomSettings>

    <ChartSeriesCollection>
        <ChartSeries DataSource="@SalesReports" XName="X" YName="YValue" Type="ChartSeriesType.Column"></ChartSeries>
    </ChartSeriesCollection>
</SfChart>

@code{
    public class ChartData
    {
        public string X { get; set; }
        public double YValue { get; set; }
    }

    public List<ChartData> SalesReports = new List<ChartData>
	{
        new ChartData { X= "USA", YValue= 46 },
        new ChartData { X= "GBR", YValue= 27 },
        new ChartData { X= "CHN", YValue= 26 },
        new ChartData { X= "UK", YValue= 26 },
        new ChartData { X= "AUS", YValue= 26 },
        new ChartData { X= "IND", YValue= 26 },
        new ChartData { X= "DEN", YValue= 26 },
        new ChartData { X= "MEX", YValue= 26 },
    };
}
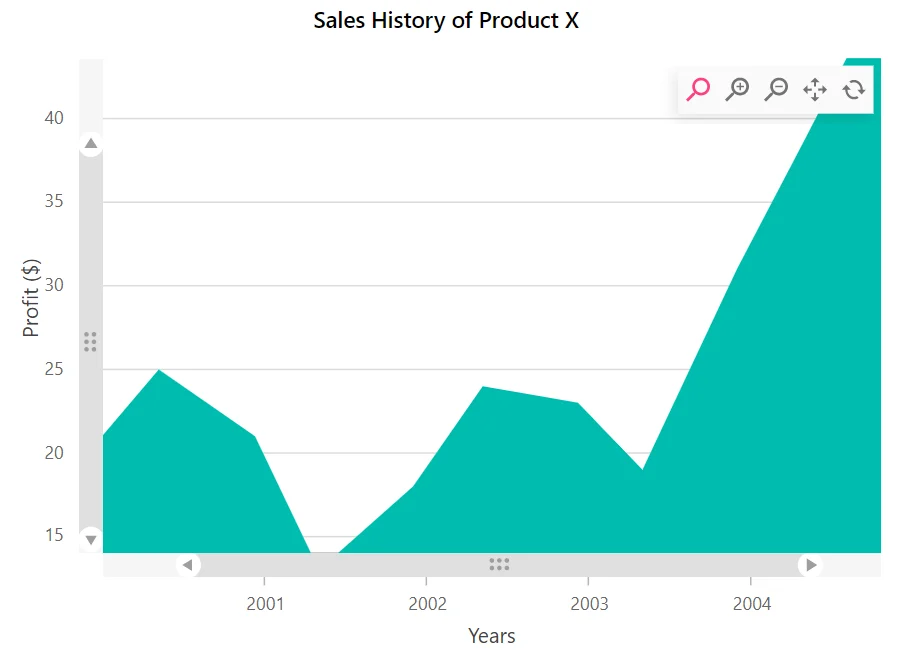
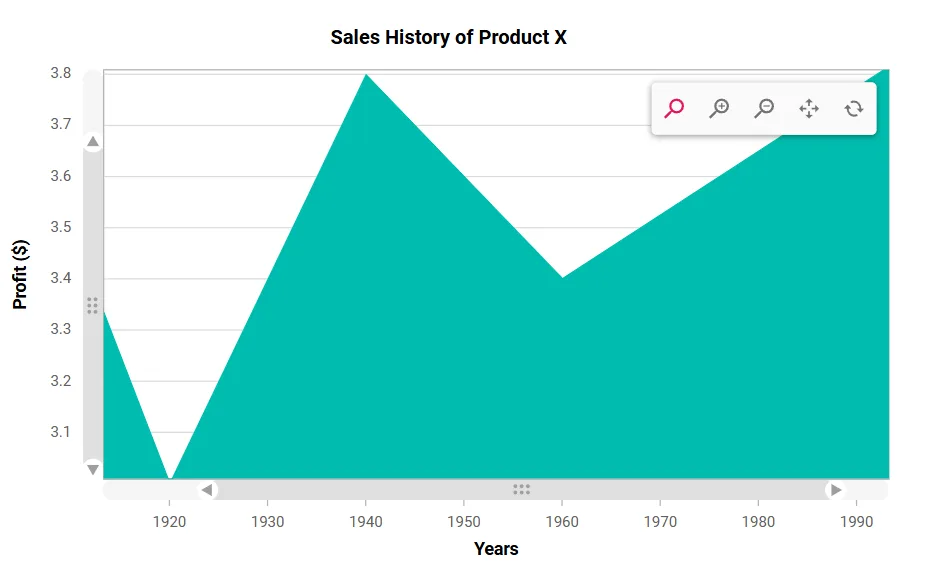
Scrollbar
Scrollbars are active when the chart is zoomed, providing flexible navigation options for the expanded chart view.
Enabling scrollbar
The EnableScrollbar property can be used to add a scrollbar to a zoomed chart. The chart can be panned or zoomed using this scrollbar.
@using Syncfusion.Blazor.Charts

<SfChart Title="Sales History of Product X">
    <ChartPrimaryXAxis Title="Years" ValueType="Syncfusion.Blazor.Charts.ValueType.DateTime"
                       Skeleton="yMMM" EdgeLabelPlacement="EdgeLabelPlacement.Shift">
        <ChartAxisMajorGridLines Width="0"></ChartAxisMajorGridLines>
    </ChartPrimaryXAxis>

    <ChartPrimaryYAxis Title="Profit ($)" RangePadding="ChartRangePadding.None">
        <ChartAxisLineStyle Width="0"></ChartAxisLineStyle>
        <ChartAxisMajorTickLines Width="0"></ChartAxisMajorTickLines>
    </ChartPrimaryYAxis>

    <ChartLegendSettings Visible="false"></ChartLegendSettings>

    <ChartZoomSettings EnableMouseWheelZooming="true" EnableScrollbar="true" EnablePinchZooming="true"
                       EnableSelectionZooming="true"></ChartZoomSettings>

    <ChartSeriesCollection>
        <ChartSeries DataSource="@SalesReports" Name="Warmest" XName="XValue" Width="2" Opacity="1"
                     YName="YValue" Type="ChartSeriesType.Area">
        </ChartSeries>
    </ChartSeriesCollection>

    <ChartArea>
        <ChartAreaBorder Width="0"></ChartAreaBorder>
    </ChartArea>
</SfChart>

@code {

    public class ChartData
    {
        public DateTime XValue { get; set; }
        public double YValue { get; set; }
    }

    public List<ChartData> SalesReports = new List<ChartData>
	{
        new ChartData { XValue = new DateTime(2000, 02, 11), YValue = 14 },
        new ChartData { XValue = new DateTime(2000, 09, 04), YValue = 20 },
        new ChartData { XValue = new DateTime(2001, 02, 11), YValue = 25 },
        new ChartData { XValue = new DateTime(2001, 09, 16), YValue = 21 },
        new ChartData { XValue = new DateTime(2002, 02, 07), YValue = 13 },
        new ChartData { XValue = new DateTime(2002, 09, 07), YValue = 18 },
        new ChartData { XValue = new DateTime(2003, 02, 11), YValue = 24 },
        new ChartData { XValue = new DateTime(2003, 09, 14), YValue = 23 },
        new ChartData { XValue = new DateTime(2004, 02, 06), YValue = 19 },
        new ChartData { XValue = new DateTime(2004, 09, 06), YValue = 31 },
        new ChartData { XValue = new DateTime(2005, 02, 11), YValue = 39 },
        new ChartData { XValue = new DateTime(2005, 09, 11), YValue = 50 },
        new ChartData { XValue = new DateTime(2006, 02, 11), YValue = 24 },
    };
}
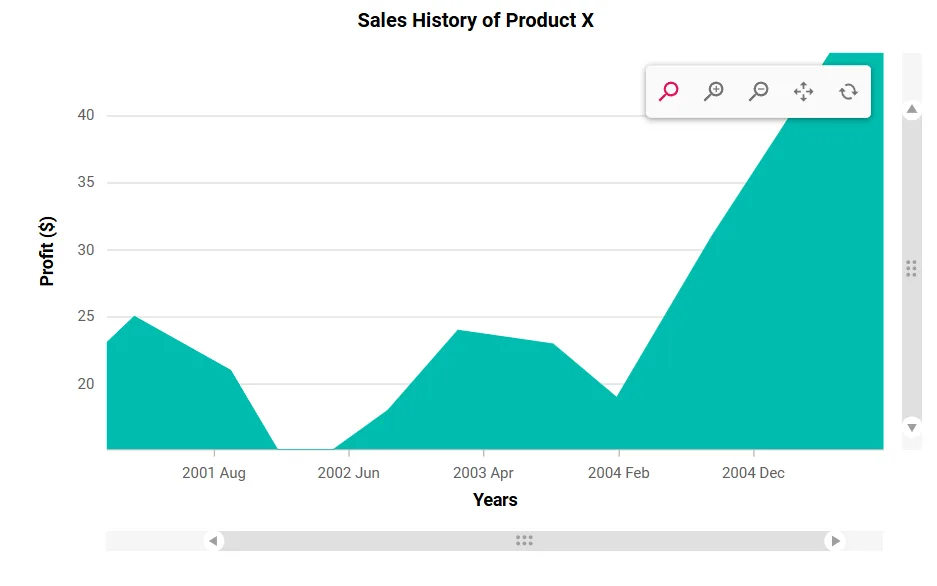
Scrollbar positioning
The Position property in ChartAxisScrollbarSettings allows users to specify their preferred scrollbar location. By default, both vertical and horizontal scrollbars are rendered near their respective axes, with the Position property value set to PlaceNextToAxisLine. Users can set Left or Right to position the vertical scrollbar and Top or Bottom to position the horizontal scrollbar.
@using Syncfusion.Blazor.Charts

<SfChart Title="Sales History of Product X">
    <ChartPrimaryXAxis Title="Years" ValueType="Syncfusion.Blazor.Charts.ValueType.DateTime"
                       EdgeLabelPlacement="EdgeLabelPlacement.Shift">
        <ChartAxisMajorGridLines Width="0"></ChartAxisMajorGridLines>
        <ChartAxisScrollbarSettings Enable="false" PointsLength="1000" Position="ScrollbarPosition.Bottom" />
    </ChartPrimaryXAxis>

    <ChartPrimaryYAxis Title="Profit ($)" RangePadding="ChartRangePadding.None">
        <ChartAxisLineStyle Width="0"></ChartAxisLineStyle>
        <ChartAxisMajorTickLines Width="0"></ChartAxisMajorTickLines>
        <ChartAxisScrollbarSettings Enable="false" PointsLength="1000" Position="ScrollbarPosition.Right" />
    </ChartPrimaryYAxis>

    <ChartSeriesCollection>
        <ChartSeries DataSource="@SalesReports" Name="Warmest" XName="XValue" Width="2" Opacity="1"
                     YName="YValue" Type="Syncfusion.Blazor.Charts.ChartSeriesType.Area">
        </ChartSeries>
    </ChartSeriesCollection>

    <ChartArea>
        <ChartAreaBorder Width="0"></ChartAreaBorder>
    </ChartArea>

    <ChartZoomSettings EnableMouseWheelZooming="true" EnableScrollbar="true" EnablePinchZooming="true"
                       EnableSelectionZooming="true"></ChartZoomSettings>
    <ChartLegendSettings Visible="false"></ChartLegendSettings>

</SfChart>

@code {
    public class ChartData
    {
        public DateTime XValue { get; set; }
        public double YValue { get; set; }
    }

    public List<ChartData> SalesReports = new List<ChartData>
    {
        new ChartData { XValue = new DateTime(2000, 02, 11), YValue = 14 },
        new ChartData { XValue = new DateTime(2000, 09, 04), YValue = 20 },
        new ChartData { XValue = new DateTime(2001, 02, 11), YValue = 25 },
        new ChartData { XValue = new DateTime(2001, 09, 16), YValue = 21 },
        new ChartData { XValue = new DateTime(2002, 02, 07), YValue = 13 },
        new ChartData { XValue = new DateTime(2002, 09, 07), YValue = 18 },
        new ChartData { XValue = new DateTime(2003, 02, 11), YValue = 24 },
        new ChartData { XValue = new DateTime(2003, 09, 14), YValue = 23 },
        new ChartData { XValue = new DateTime(2004, 02, 06), YValue = 19 },
        new ChartData { XValue = new DateTime(2004, 09, 06), YValue = 31 },
        new ChartData { XValue = new DateTime(2005, 02, 11), YValue = 39 },
        new ChartData { XValue = new DateTime(2005, 09, 11), YValue = 50 },
        new ChartData { XValue = new DateTime(2006, 02, 11), YValue = 24 },
    };
}
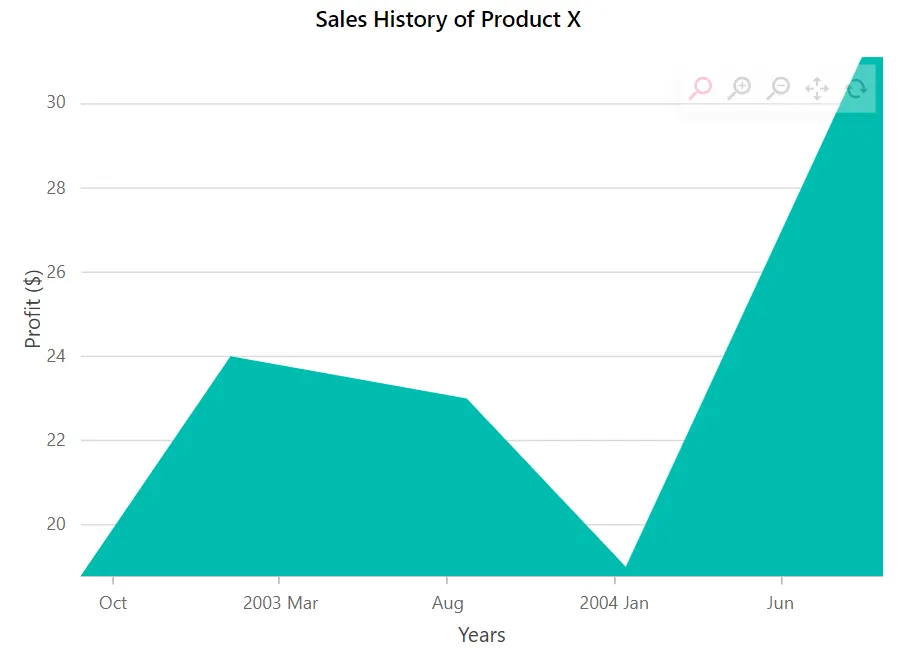
Customization
Scrollbar appearance and behavior are customizable using ChartAxisScrollbarSettings:
- TrackColor: Specifies the track color.
- TrackRadius: Specifies the track corner radius.
- ScrollbarColor: Specifies the scrollbar color.
- ScrollbarRadius: Specifies the scrollbar corner radius.
- GripColor: Specifies the grip color. The grip is the draggable handle (thumb) within the scrollbar used to move the visible range.
- Height: Specifies the scrollbar height.
- EnableZoom: Enables or disables zooming via the scrollbar. When enabled, arrows appear at the scrollbar ends to zoom in or out; when disabled, arrows are hidden and zooming via the scrollbar is unavailable.
@using Syncfusion.Blazor.Charts

<SfChart Title="Sales History of Product X" >
    <ChartPrimaryXAxis Title="Years" EdgeLabelPlacement="EdgeLabelPlacement.Shift">
        <ChartAxisMajorGridLines Width="0"></ChartAxisMajorGridLines>
        <ChartAxisScrollbarSettings Enable="false" PointsLength="1000" Height="16" EnableZoom="true"
             TrackRadius="8" ScrollbarRadius="8" GripColor="#9e9e9e" TrackColor="#f5f5f5" ScrollbarColor="#e0e0e0" />
    </ChartPrimaryXAxis>

    <ChartPrimaryYAxis Title="Profit ($)" RangePadding="ChartRangePadding.None">
        <ChartAxisLineStyle Width="0"></ChartAxisLineStyle>
        <ChartAxisMajorTickLines Width="0"></ChartAxisMajorTickLines>
        <ChartAxisScrollbarSettings Enable="false" PointsLength="1000" Height="16" EnableZoom="true"
             TrackRadius="8" ScrollbarRadius="8" GripColor="#9e9e9e" TrackColor="#f5f5f5" ScrollbarColor="#e0e0e0" />
    </ChartPrimaryYAxis>

    <ChartLegendSettings Visible="false"></ChartLegendSettings>

    <ChartZoomSettings EnableMouseWheelZooming="true" EnableScrollbar="true" EnablePinchZooming="true"
        EnableSelectionZooming="true"></ChartZoomSettings>

    <ChartSeriesCollection>
        <ChartSeries DataSource="@SalesDetails" XName="X" YName="Y" Type="Syncfusion.Blazor.Charts.ChartSeriesType.Area">
        </ChartSeries>
    </ChartSeriesCollection>

</SfChart>

@code {

    public class ChartData
    {
        public double X { get; set; }
        public double Y { get; set; }
    }
    public List<ChartData> SalesDetails = new List<ChartData>
    {
        new ChartData { X= 1900, Y= 4 },
        new ChartData { X= 1920, Y= 3.0 },
        new ChartData { X= 1940, Y= 3.8 },
        new ChartData { X= 1960, Y= 3.4 },
        new ChartData { X= 2000, Y= 3.9 }
    };
}
Auto interval on zooming
The axis interval will be calculated automatically with respect to the zoomed range, if the EnableAutoIntervalOnZooming property is set to true.
@using Syncfusion.Blazor.Charts

<SfChart Title="Sales History of Product X">
    <ChartPrimaryXAxis Title="Years" ValueType="Syncfusion.Blazor.Charts.ValueType.DateTime"
                       Skeleton="yMMM" EdgeLabelPlacement="EdgeLabelPlacement.Shift" EnableAutoIntervalOnZooming="true">
        <ChartAxisMajorGridLines Width="0"></ChartAxisMajorGridLines>
    </ChartPrimaryXAxis>

    <ChartPrimaryYAxis Title="Profit ($)" RangePadding="ChartRangePadding.None">
        <ChartAxisLineStyle Width="0"></ChartAxisLineStyle>
        <ChartAxisMajorTickLines Width="0"></ChartAxisMajorTickLines>
    </ChartPrimaryYAxis>

    <ChartLegendSettings Visible="false"></ChartLegendSettings>

    <ChartZoomSettings EnableMouseWheelZooming="true" EnablePinchZooming="true"
                       EnableSelectionZooming="true"></ChartZoomSettings>

    <ChartSeriesCollection>
        <ChartSeries DataSource="@SalesReports" Name="Warmest" XName="XValue" Width="2" Opacity="1"
                     YName="YValue" Type="ChartSeriesType.Area">
        </ChartSeries>
    </ChartSeriesCollection>

    <ChartArea>
        <ChartAreaBorder Width="0"></ChartAreaBorder>
    </ChartArea>
</SfChart>

@code {

    public class ChartData
    {
        public DateTime XValue { get; set; }
        public double YValue { get; set; }
    }

    public List<ChartData> SalesReports = new List<ChartData>
	{
        new ChartData { XValue = new DateTime(2000, 02, 11), YValue = 14 },
        new ChartData { XValue = new DateTime(2000, 09, 04), YValue = 20 },
        new ChartData { XValue = new DateTime(2001, 02, 11), YValue = 25 },
        new ChartData { XValue = new DateTime(2001, 09, 16), YValue = 21 },
        new ChartData { XValue = new DateTime(2002, 02, 07), YValue = 13 },
        new ChartData { XValue = new DateTime(2002, 09, 07), YValue = 18 },
        new ChartData { XValue = new DateTime(2003, 02, 11), YValue = 24 },
        new ChartData { XValue = new DateTime(2003, 09, 14), YValue = 23 },
        new ChartData { XValue = new DateTime(2004, 02, 06), YValue = 19 },
        new ChartData { XValue = new DateTime(2004, 09, 06), YValue = 31 },
        new ChartData { XValue = new DateTime(2005, 02, 11), YValue = 39 },
        new ChartData { XValue = new DateTime(2005, 09, 11), YValue = 50 },
        new ChartData { XValue = new DateTime(2006, 02, 11), YValue = 24 },
    };
}
NOTE
Refer to the Blazor Charts feature tour page for its groundbreaking feature representations and also explore the Blazor Chart Example to know various chart types and how to represent time-dependent data, showing trends at equal intervals.