Getting Started with Blazor Chart Wizard Component in Web App
26 Jun 202613 minutes to read
This section briefly explains about how to include Blazor Chart Wizard component in your Blazor Web App using Visual Studio, Visual Studio Code, and the .NET CLI.
Ready to streamline your Blazor development?
Discover the full potential of Blazor components with AI Coding Assistants. Effortlessly integrate, configure, and enhance your projects with intelligent, context-aware code suggestions, streamlined setups, and real-time insights—all seamlessly integrated into your preferred AI-powered IDEs like VS Code, Cursor, CodeStudio and more. Explore AI Coding Assistants
Prerequisites
Create a new Blazor Web App in Visual Studio
Create a Blazor Web App using Visual Studio via Microsoft Templates or the Syncfusion® Blazor Extension. For detailed instructions, refer to the Blazor Web App Getting Started documentation.
Prerequisites
Create a new Blazor Web App in Visual Studio Code
Create a Blazor Web App using Visual Studio Code via Microsoft Templates or the Syncfusion® Blazor Extension. For detailed instructions, refer to the Blazor Web App Getting Started documentation.
For example, in a Blazor Web App with the Auto interactive render mode, use the following commands in the integrated terminal (Ctrl+`).
dotnet new blazor -o BlazorWebApp -int Auto
cd BlazorWebApp
cd BlazorWebApp.Client
Prerequisites
Install the latest version of .NET SDK. If you previously installed the SDK, you can determine the installed version by executing the following command in a command prompt (Windows) or terminal (macOS) or command shell (Linux).
dotnet --versionCreate a Blazor Web App using .NET CLI
Run the following command to create a new Blazor Web App in a command prompt (Windows) or terminal (macOS) or command shell (Linux). For detailed instructions, refer to the Blazor Web App Getting Started documentation.
For example, in a Blazor Web App with the Auto interactive render mode, use the following commands:
dotnet new blazor -o BlazorApp -int Auto
cd BlazorApp
cd BlazorApp.Client
This command creates new Blazor Web App and places it in a new directory called BlazorApp inside your current location. See Create Blazor app topic and dotnet new CLI command topics for more details.
NOTE
Configure the appropriate Interactive render mode and Interactivity location while creating a Blazor Web App. For detailed information, refer to the interactive render mode documentation.
Install required Blazor packages
Install Syncfusion.Blazor.ChartWizard NuGet package in your project using the NuGet Package Manager in Visual Studio (Tools → NuGet Package Manager → Manage NuGet Packages for Solution), or the integrated terminal in Visual Studio Code (dotnet add package), or the .NET CLI.
Alternatively, run the following command in the Package Manager Console to achieve the same.
Install-Package Syncfusion.Blazor.ChartWizard -Version 34.1.29If using the WebAssembly or Auto render modes in the Blazor Web App, install this package in the client project.
NOTE
All Blazor packages are available on nuget.org. See the NuGet packages topic for details.
Add Import Namespaces
After the package is installed, open the ~/_Imports.razor file from the client project and import the Syncfusion.Blazor and Syncfusion.Blazor.ChartWizard namespaces.
@using Syncfusion.Blazor
@using Syncfusion.Blazor.ChartWizard
Register Blazor Service
Register the Blazor Service in the Program.cs file of your Blazor Web App.
....
using Syncfusion.Blazor;
....
builder.Services.AddSyncfusionBlazor();
....
NOTE
If the Interactive Render Mode is set to
WebAssemblyorAuto, register the Blazor service in Program.cs files of both the server and client projects in your Blazor Web App.
Add script resources
The script can be accessed from NuGet through Static Web Assets. Include the script reference in the ~/Components/App.razor file.
<script src="_content/Syncfusion.Blazor.Core/scripts/syncfusion-blazor.min.js" type="text/javascript"></script>NOTE
Check out the Adding Script Reference topic to learn different approaches for adding script references in your Blazor application.
Add Blazor Chart Wizard component
Add the Blazor Chart Wizard component in the ~/Components/Pages/*.razor file. If the interactivity location is set to Per page/component in the Web App, define a render mode at the top of the ~Pages/*.razor file. (For example, InteractiveServer, InteractiveWebAssembly or InteractiveAuto).
NOTE
If the Interactivity Location is set to
GlobalwithAutoorWebAssembly, the render mode is automatically configured in theApp.razorfile by default.
@* desired render mode define here *@
@rendermode InteractiveAuto<SfChartWizard>
</SfChartWizard>- Press Ctrl+F5 (Windows) or ⌘+F5 (macOS) to launch the application. This will render the Blazor Chart Wizard component in the default web browser.
Populate Blazor Chart Wizard data
To bind data for the chart wizard component, you can assign a IEnumerable object to the DataSource property.
public class OlympicsData
{
public string? Country { get; set; }
public string? CountryCode { get; set; }
public int Gold { get; set; }
public int Silver { get; set; }
public int Bronze { get; set; }
}
private readonly List<OlympicsData> OlympicsDataSource = new()
{
new OlympicsData { Country = "USA", CountryCode = "USA", Gold = 40, Silver = 44, Bronze = 42 },
new OlympicsData { Country = "China", CountryCode = "CHN", Gold = 40, Silver = 27, Bronze = 24 },
new OlympicsData { Country = "Great Britain", CountryCode = "GBR", Gold = 14, Silver = 22, Bronze = 29 },
new OlympicsData { Country = "France", CountryCode = "FRA", Gold = 16, Silver = 26, Bronze = 22 },
new OlympicsData { Country = "Australia", CountryCode = "AUS", Gold = 18, Silver = 19, Bronze = 16 },
new OlympicsData { Country = "Japan", CountryCode = "JPN", Gold = 20, Silver = 12, Bronze = 13 },
new OlympicsData { Country = "Italy", CountryCode = "ITA", Gold = 12, Silver = 13, Bronze = 15 },
new OlympicsData { Country = "Netherlands", CountryCode = "NLD", Gold = 15, Silver = 7, Bronze = 12 },
new OlympicsData { Country = "Germany", CountryCode = "DEU", Gold = 12, Silver = 13, Bronze = 8 },
new OlympicsData { Country = "South Korea", CountryCode = "KOR", Gold = 13, Silver = 9, Bronze = 10 }
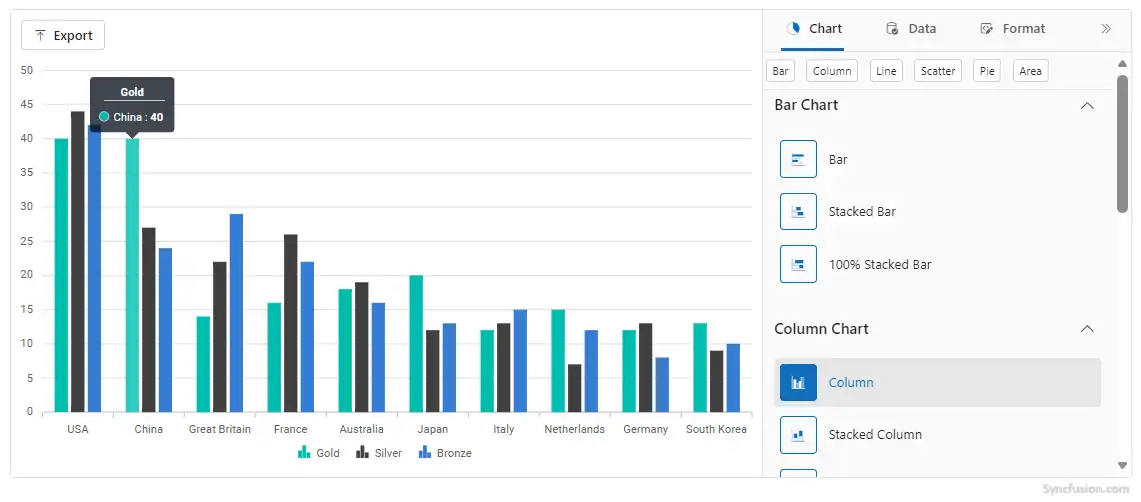
};Now, populate the categories and chartSeries collections with the appropriate data defining the chart’s categories and series. Then, assign these values to the CategoryFields and SeriesFields properties of the ChartSettings, respectively.
NOTE
The default series type is Line. Use the
SeriesTypeproperty to change the series type.
@using Syncfusion.Blazor.ChartWizard

<div class="control-section">
    <SfChartWizard>
        <ChartSettings DataSource="@OlympicsDataSource"
                       CategoryFields="@categories"
                       SeriesType="ChartWizardSeriesType.Column"
                       SeriesFields="@chartSeries">
        </ChartSettings>
    </SfChartWizard>
</div>

@code {
    private readonly List<string> chartSeries = new() { "Gold", "Silver", "Bronze" };
    private readonly List<string> categories = new() { "Country", "CountryCode" };

    public class OlympicsData
    {
        public string? Country { get; set; }
        public string? CountryCode { get; set; }
        public int Gold { get; set; }
        public int Silver { get; set; }
        public int Bronze { get; set; }
    }

    private readonly List<OlympicsData> OlympicsDataSource = new()
    {
        new OlympicsData { Country = "USA", CountryCode = "USA", Gold = 40, Silver = 44, Bronze = 42 },
        new OlympicsData { Country = "China", CountryCode = "CHN", Gold = 40, Silver = 27, Bronze = 24 },
        new OlympicsData { Country = "Great Britain", CountryCode = "GBR", Gold = 14, Silver = 22, Bronze = 29 },
        new OlympicsData { Country = "France", CountryCode = "FRA", Gold = 16, Silver = 26, Bronze = 22 },
        new OlympicsData { Country = "Australia", CountryCode = "AUS", Gold = 18, Silver = 19, Bronze = 16 },
        new OlympicsData { Country = "Japan", CountryCode = "JPN", Gold = 20, Silver = 12, Bronze = 13 },
        new OlympicsData { Country = "Italy", CountryCode = "ITA", Gold = 12, Silver = 13, Bronze = 15 },
        new OlympicsData { Country = "Netherlands", CountryCode = "NLD", Gold = 15, Silver = 7,  Bronze = 12 },
        new OlympicsData { Country = "Germany", CountryCode = "DEU", Gold = 12, Silver = 13, Bronze = 8  },
        new OlympicsData { Country = "South Korea", CountryCode = "KOR", Gold = 13, Silver = 9,  Bronze = 10 }
    };
}
Theme
Blazor Chart Wizard has built-in themes that can be used to change the appearance of the chart.
Prerequisites
In order to apply same theme update for the overall Chart Wizard UI, include the same theme stylesheet (this can be accessed from NuGet through Static Web Assets) in the <head> tag in the App.razor file as shown below:
<head>
....
<link href="_content/Syncfusion.Blazor.Themes/material3.css" rel="stylesheet" />
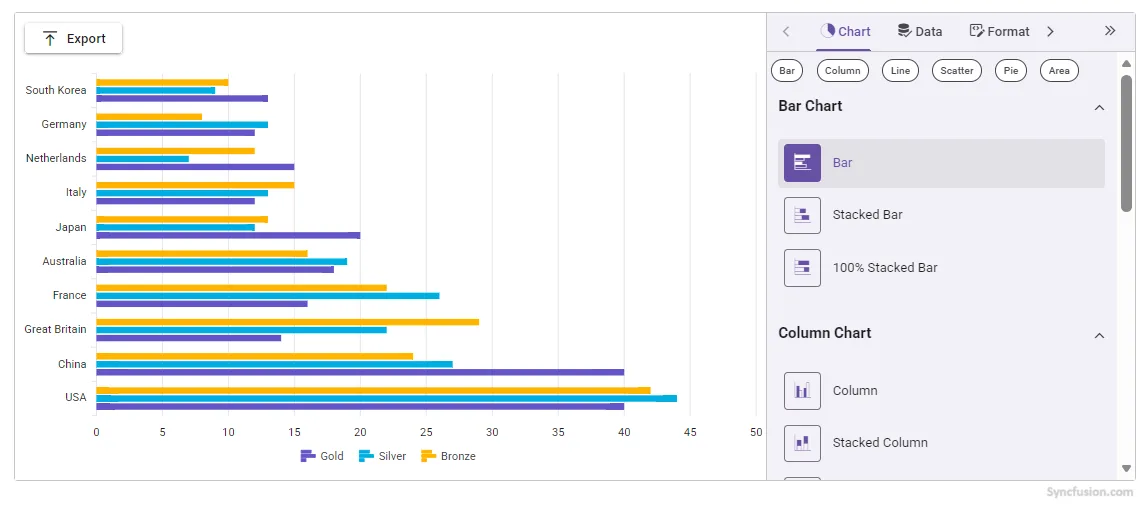
</head>The Theme property is used to specify the visual theme applied to the chart.
@using Syncfusion.Blazor.ChartWizard

<div class="control-section">
    <SfChartWizard Theme="Theme.Material3">
        <ChartSettings DataSource="@OlympicsDataSource"
                       CategoryFields="@categories"
                       SeriesType="ChartWizardSeriesType.Bar"
                       SeriesFields="@chartSeries">
        </ChartSettings>
    </SfChartWizard>
</div>

@code {
    private readonly List<string> chartSeries = new() { "Gold", "Silver", "Bronze" };
    private readonly List<string> categories = new() { "Country", "CountryCode" };

    public class OlympicsData
    {
        public string? Country { get; set; }
        public string? CountryCode { get; set; }
        public int Gold { get; set; }
        public int Silver { get; set; }
        public int Bronze { get; set; }
    }

    private readonly List<OlympicsData> OlympicsDataSource = new()
    {
        new OlympicsData { Country = "USA", CountryCode = "USA", Gold = 40, Silver = 44, Bronze = 42 },
        new OlympicsData { Country = "China", CountryCode = "CHN", Gold = 40, Silver = 27, Bronze = 24 },
        new OlympicsData { Country = "Great Britain", CountryCode = "GBR", Gold = 14, Silver = 22, Bronze = 29 },
        new OlympicsData { Country = "France", CountryCode = "FRA", Gold = 16, Silver = 26, Bronze = 22 },
        new OlympicsData { Country = "Australia", CountryCode = "AUS", Gold = 18, Silver = 19, Bronze = 16 },
        new OlympicsData { Country = "Japan", CountryCode = "JPN", Gold = 20, Silver = 12, Bronze = 13 },
        new OlympicsData { Country = "Italy", CountryCode = "ITA", Gold = 12, Silver = 13, Bronze = 15 },
        new OlympicsData { Country = "Netherlands", CountryCode = "NLD", Gold = 15, Silver = 7,  Bronze = 12 },
        new OlympicsData { Country = "Germany", CountryCode = "DEU", Gold = 12, Silver = 13, Bronze = 8  },
        new OlympicsData { Country = "South Korea", CountryCode = "KOR", Gold = 13, Silver = 9,  Bronze = 10 }
    };
}