Category Axis in Blazor Charts Component
12 Nov 20256 minutes to read
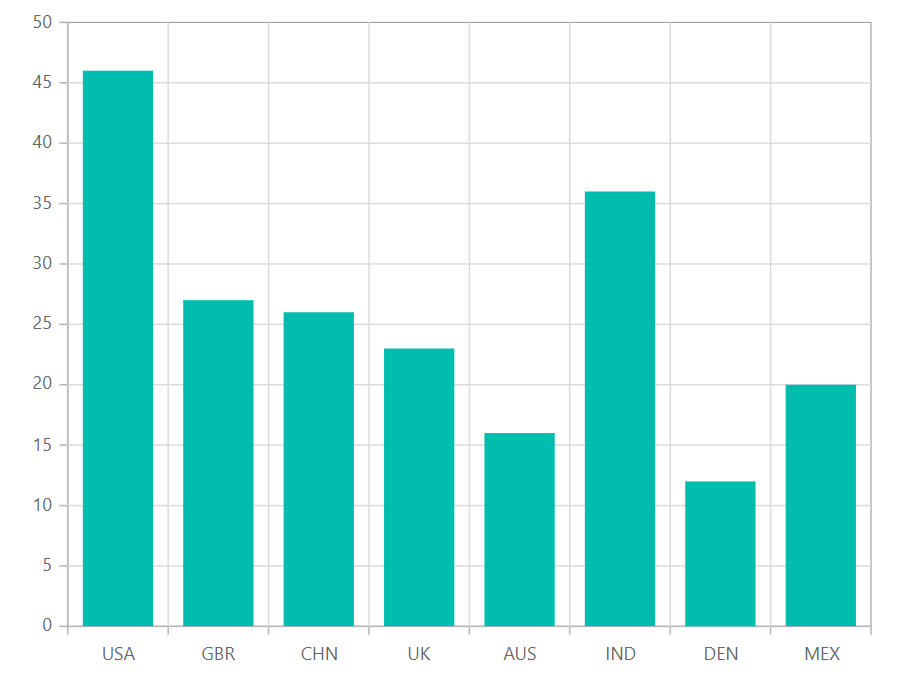
The category axis is used to represent string values instead of integers.
You can learn how to customize the category axis by watching the video below.
@using Syncfusion.Blazor.Charts

<SfChart>
    <ChartPrimaryXAxis ValueType="Syncfusion.Blazor.Charts.ValueType.Category">
    </ChartPrimaryXAxis>

    <ChartSeriesCollection>
        <ChartSeries DataSource="@MedalDetails" XName="X" YName="YValue" Type="ChartSeriesType.Column">
        </ChartSeries>
    </ChartSeriesCollection>
</SfChart>

@code{
    public class ChartData
    {
        public string X { get; set; }
        public double YValue { get; set; }
    }

    public List<ChartData> MedalDetails = new List<ChartData>
	{
        new ChartData { X= "USA", YValue= 46 },
        new ChartData { X= "GBR", YValue= 27 },
        new ChartData { X= "CHN", YValue= 26 },
        new ChartData { X= "UK", YValue= 23 },
        new ChartData { X= "AUS", YValue= 16 },
        new ChartData { X= "IND", YValue= 36 },
        new ChartData { X= "DEN", YValue= 12 },
        new ChartData { X= "MEX", YValue= 20 },
    };
}
Labels placement
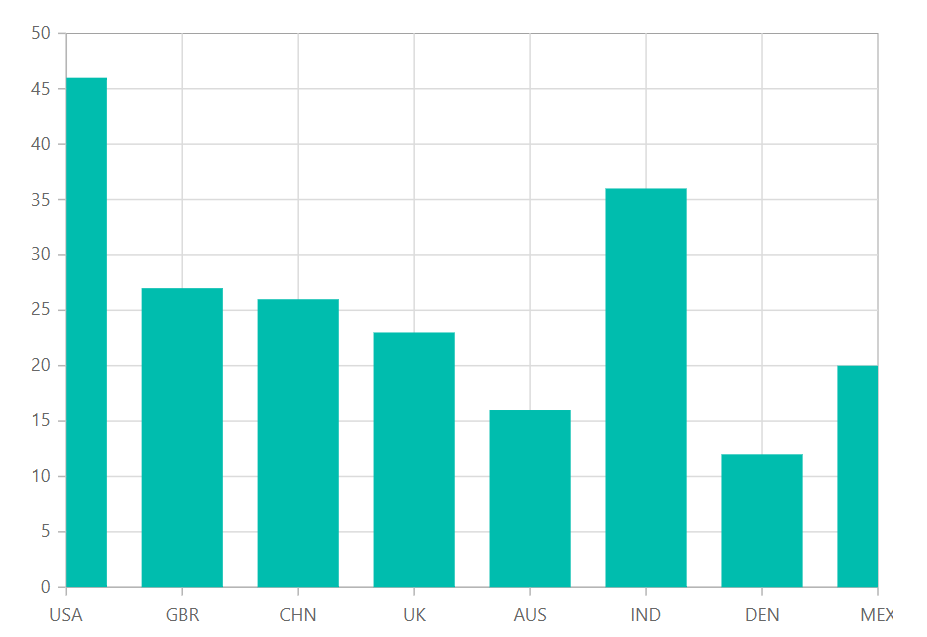
The category labels are positioned between ticks by default, but the LabelPlacement property allows them to be placed on the ticks as well. The available options are BetweenTicks (default) and OnTicks.
@using Syncfusion.Blazor.Charts

<SfChart>
    <ChartPrimaryXAxis LabelPlacement="LabelPlacement.OnTicks" ValueType="Syncfusion.Blazor.Charts.ValueType.Category">
    </ChartPrimaryXAxis>

    <ChartSeriesCollection>
        <ChartSeries DataSource="@MedalDetails" XName="X" YName="YValue" Type="ChartSeriesType.Column">
        </ChartSeries>
    </ChartSeriesCollection>
</SfChart>

@code{
    public class ChartData
    {
        public string X { get; set; }
        public double YValue { get; set; }
    }

    public List<ChartData> MedalDetails = new List<ChartData>
	{
        new ChartData { X= "USA", YValue= 46 },
        new ChartData { X= "GBR", YValue= 27 },
        new ChartData { X= "CHN", YValue= 26 },
        new ChartData { X= "UK", YValue= 23 },
        new ChartData { X= "AUS", YValue= 16 },
        new ChartData { X= "IND", YValue= 36 },
        new ChartData { X= "DEN", YValue= 12 },
        new ChartData { X= "MEX", YValue= 20 },
    };
}
Range and interval
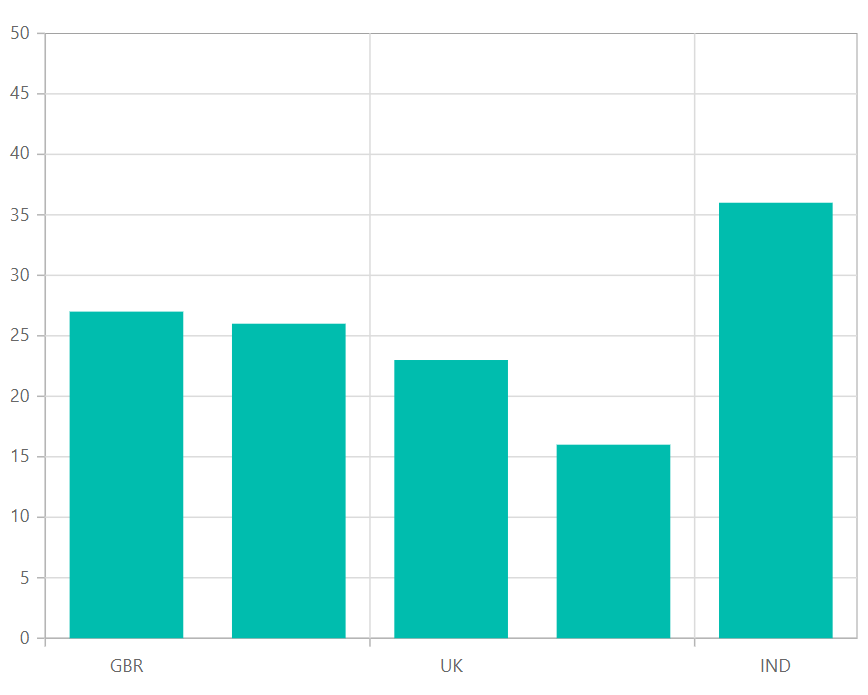
The Minimum, Maximum, and Interval properties can be used to customize the range of the Category axis.
@using Syncfusion.Blazor.Charts

<SfChart>
    <ChartPrimaryXAxis Maximum="5" Minimum="1" Interval="2" ValueType="Syncfusion.Blazor.Charts.ValueType.Category">
    </ChartPrimaryXAxis>

    <ChartSeriesCollection>
        <ChartSeries DataSource="@MedalDetails" XName="X" YName="YValue" Type="ChartSeriesType.Column">
        </ChartSeries>
    </ChartSeriesCollection>
</SfChart>

@code{
    public class ChartData
    {
        public string X { get; set; }
        public double YValue { get; set; }
    }

    public List<ChartData> MedalDetails = new List<ChartData>
	{
        new ChartData { X= "USA", YValue= 46 },
        new ChartData { X= "GBR", YValue= 27 },
        new ChartData { X= "CHN", YValue= 26 },
        new ChartData { X= "UK", YValue= 23 },
        new ChartData { X= "AUS", YValue= 16 },
        new ChartData { X= "IND", YValue= 36 },
        new ChartData { X= "DEN", YValue= 12 },
        new ChartData { X= "MEX", YValue= 20 },
    };
}
Indexed category axis
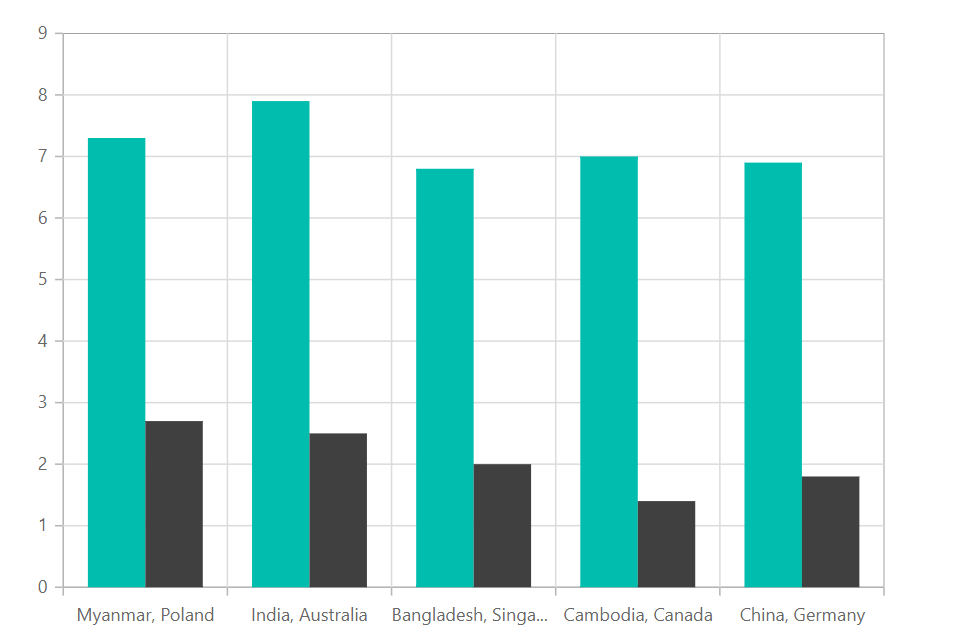
The category axis can also be rendered using the data source index values. This can be achieved by setting the IsIndexed property in the axis to true.
@using Syncfusion.Blazor.Charts

<SfChart>
    <ChartPrimaryXAxis IsIndexed="true" ValueType="Syncfusion.Blazor.Charts.ValueType.Category">
    </ChartPrimaryXAxis>

    <ChartSeriesCollection>
        <ChartSeries DataSource="@WeatherReports1" XName="X" YName="Y" Type="ChartSeriesType.Column">
        </ChartSeries>
        <ChartSeries DataSource="@WeatherReports2" XName="X" YName="Y" Type="ChartSeriesType.Column">
        </ChartSeries>
    </ChartSeriesCollection>
</SfChart>

@code{
    public class WeatherData
    {
        public string X { get; set; }
        public double Y { get; set; }
    }

    public List<WeatherData> WeatherReports1 = new List<WeatherData>
	{
        new WeatherData{ X= "Myanmar", Y= 7.3 },
        new WeatherData{ X= "India", Y= 7.9 },
        new WeatherData{ X= "Bangladesh", Y= 6.8 },
        new WeatherData{ X= "Cambodia", Y=7.0 },
        new WeatherData{ X= "China", Y= 6.9 }
    };

    public List<WeatherData> WeatherReports2 = new List<WeatherData>
	{
        new WeatherData{ X= "Poland", Y=2.7 },
        new WeatherData{ X= "Australia", Y=2.5 },
        new WeatherData{ X= "Singapore", Y=2.0 },
        new WeatherData{ X= "Canada", Y=1.4 },
        new WeatherData{ X= "Germany", Y=1.8 }
    };
}
NOTE
Refer to our Blazor Charts feature tour page for its groundbreaking feature representations and also explore our Blazor Chart Example to knows various chart types and how to represent time-dependent data, showing trends in data at equal intervals.