Box and Whisker in Blazor Charts Component
16 Jul 202624 minutes to read
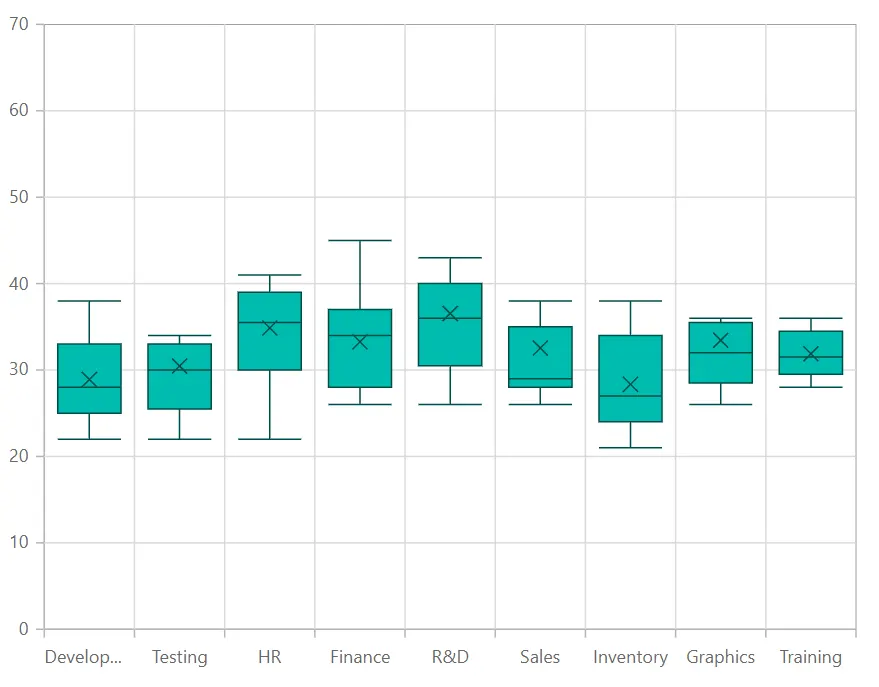
Box and Whisker
Box and Whisker Chart is used to visualize the variation in a set of data and it can be rendered by specifying the series Type as BoxAndWhisker. The property YName requires n number of data or it should contain minimum of five values. Here’s a concise guide on how to do this:
-
Set the series type: Define the series Type as BoxAndWhisker in your chart configuration. This indicates that the data should be represented as a box and whisker chart, which will plot segments to illustrate the statistical distribution of the data.
-
Provide data requirements: The y field of the Box and Whisker series requires a specific number of data points, with a minimum of five values needed to plot a segment.
@using Syncfusion.Blazor.Charts

<SfChart>
    <ChartPrimaryXAxis ValueType="Syncfusion.Blazor.Charts.ValueType.Category">
    </ChartPrimaryXAxis>

    <ChartSeriesCollection>
        <ChartSeries DataSource="@ExpenseDetails" XName="XValue" YName="YValue" Type="ChartSeriesType.BoxAndWhisker">
        </ChartSeries>
    </ChartSeriesCollection>
</SfChart>

@code{
    public class ChartData
    {
        public string XValue { get; set; }
        public double[] YValue { get; set; }
    }

    public List<ChartData> ExpenseDetails = new List<ChartData>
	{
        new ChartData { XValue = "Development", YValue = new double[]{ 22, 22, 23, 25, 25, 25, 26, 27, 27, 28, 28, 29, 30, 32, 34, 32, 34, 36, 35, 38 } },
        new ChartData { XValue = "Testing", YValue = new double[] { 22, 33, 23, 25, 26, 28, 29, 30, 34, 33, 32, 31, 50 }},
        new ChartData { XValue = "HR", YValue = new double[] { 22, 24, 25, 30, 32, 34, 36, 38, 39, 41, 35, 36, 40, 56 } },
        new ChartData { XValue = "Finance", YValue =  new double[] { 26, 27, 28, 30, 32, 34, 35, 37, 35, 37, 45 } },
        new ChartData { XValue = "R&D", YValue = new double[] { 26, 27, 29, 32, 34, 35, 36, 37, 38, 39, 41, 43, 58 } },
        new ChartData { XValue = "Sales", YValue = new double[] { 27, 26, 28, 29, 29, 29, 32, 35, 32, 38, 53 } },
        new ChartData { XValue = "Inventory", YValue = new double[] { 21, 23, 24, 25, 26, 27, 28, 30, 34, 36, 38 } },
        new ChartData { XValue = "Graphics", YValue = new double[] { 26, 28, 29, 30, 32, 33, 35, 36, 52 } },
        new ChartData { XValue = "Training", YValue = new double[] { 28, 29, 30, 31, 32, 34, 35, 36 } }
    };
}
NOTE
Refer to our Blazor Box and Whisker Charts feature tour page to know about its other groundbreaking feature representations. Explore our Blazor Box and Whisker Chart Example to know how to render and configure the box and whisker type charts.
Binding data with series
You can bind data to the chart using the DataSource property within the series configuration. The DataSource value can be set using either SfDataManager property values or a list of business objects. More information on data binding can be found here. To display the data correctly, map the fields from the data to the chart series’ XName and YName properties.
@using Syncfusion.Blazor.Charts

<SfChart>
    <ChartPrimaryXAxis ValueType="Syncfusion.Blazor.Charts.ValueType.Category">
    </ChartPrimaryXAxis>

    <ChartSeriesCollection>
        <ChartSeries DataSource="@ExpenseDetails" XName="XValue" YName="YValue" Type="ChartSeriesType.BoxAndWhisker">
        </ChartSeries>
    </ChartSeriesCollection>
</SfChart>

@code{
    public class ChartData
    {
        public string XValue { get; set; }
        public double[] YValue { get; set; }
    }

    public List<ChartData> ExpenseDetails = new List<ChartData>
	{
        new ChartData { XValue = "Development", YValue = new double[]{ 22, 22, 23, 25, 25, 25, 26, 27, 27, 28, 28, 29, 30, 32, 34, 32, 34, 36, 35, 38 } },
        new ChartData { XValue = "Testing", YValue = new double[] { 22, 33, 23, 25, 26, 28, 29, 30, 34, 33, 32, 31, 50 }},
        new ChartData { XValue = "HR", YValue = new double[] { 22, 24, 25, 30, 32, 34, 36, 38, 39, 41, 35, 36, 40, 56 } },
        new ChartData { XValue = "Finance", YValue =  new double[] { 26, 27, 28, 30, 32, 34, 35, 37, 35, 37, 45 } },
        new ChartData { XValue = "R&D", YValue = new double[] { 26, 27, 29, 32, 34, 35, 36, 37, 38, 39, 41, 43, 58 } },
        new ChartData { XValue = "Sales", YValue = new double[] { 27, 26, 28, 29, 29, 29, 32, 35, 32, 38, 53 } },
        new ChartData { XValue = "Inventory", YValue = new double[] { 21, 23, 24, 25, 26, 27, 28, 30, 34, 36, 38 } },
        new ChartData { XValue = "Graphics", YValue = new double[] { 26, 28, 29, 30, 32, 33, 35, 36, 52 } },
        new ChartData { XValue = "Training", YValue = new double[] { 28, 29, 30, 31, 32, 34, 35, 36 } }
    };
}Series customization
The following properties can be used to customize the BoxAndWhisker series.
Fill
The Fill property determines the color applied to the series.
@using Syncfusion.Blazor.Charts

<SfChart>
    <ChartPrimaryXAxis ValueType="Syncfusion.Blazor.Charts.ValueType.Category">
    </ChartPrimaryXAxis>

    <ChartSeriesCollection>
        <ChartSeries DataSource="@ExpenseDetails" XName="XValue" YName="YValue" Type="Syncfusion.Blazor.Charts.ChartSeriesType.BoxAndWhisker" Fill="blue">
        </ChartSeries>
    </ChartSeriesCollection>
</SfChart>

@code {
    public class ChartData
    {
        public string XValue { get; set; }
        public double[] YValue { get; set; }
    }

    public List<ChartData> ExpenseDetails = new List<ChartData>
    {
        new ChartData { XValue = "Development", YValue = new double[]{ 22, 22, 23, 25, 25, 25, 26, 27, 27, 28, 28, 29, 30, 32, 34, 32, 34, 36, 35, 38 } },
        new ChartData { XValue = "Testing", YValue = new double[] { 22, 33, 23, 25, 26, 28, 29, 30, 34, 33, 32, 31, 50 }},
        new ChartData { XValue = "HR", YValue = new double[] { 22, 24, 25, 30, 32, 34, 36, 38, 39, 41, 35, 36, 40, 56 } },
        new ChartData { XValue = "Finance", YValue =  new double[] { 26, 27, 28, 30, 32, 34, 35, 37, 35, 37, 45 } },
        new ChartData { XValue = "R&D", YValue = new double[] { 26, 27, 29, 32, 34, 35, 36, 37, 38, 39, 41, 43, 58 } },
        new ChartData { XValue = "Sales", YValue = new double[] { 27, 26, 28, 29, 29, 29, 32, 35, 32, 38, 53 } },
        new ChartData { XValue = "Inventory", YValue = new double[] { 21, 23, 24, 25, 26, 27, 28, 30, 34, 36, 38 } },
        new ChartData { XValue = "Graphics", YValue = new double[] { 26, 28, 29, 30, 32, 33, 35, 36, 52 } },
        new ChartData { XValue = "Training", YValue = new double[] { 28, 29, 30, 31, 32, 34, 35, 36 } }
    };
}Opacity
The Opacity property specifies the transparency level of the Fill. Adjusting this property allows you to control how opaque or transparent the fill color of the series appears.
@using Syncfusion.Blazor.Charts

<SfChart>
    <ChartPrimaryXAxis ValueType="Syncfusion.Blazor.Charts.ValueType.Category">
    </ChartPrimaryXAxis>

    <ChartSeriesCollection>
        <ChartSeries DataSource="@ExpenseDetails" XName="XValue" YName="YValue" Fill="blue" Opacity="0.5" Type="Syncfusion.Blazor.Charts.ChartSeriesType.BoxAndWhisker">
        </ChartSeries>
    </ChartSeriesCollection>
</SfChart>

@code {
    public class ChartData
    {
        public string XValue { get; set; }
        public double[] YValue { get; set; }
    }

    public List<ChartData> ExpenseDetails = new List<ChartData>
    {
        new ChartData { XValue = "Development", YValue = new double[]{ 22, 22, 23, 25, 25, 25, 26, 27, 27, 28, 28, 29, 30, 32, 34, 32, 34, 36, 35, 38 } },
        new ChartData { XValue = "Testing", YValue = new double[] { 22, 33, 23, 25, 26, 28, 29, 30, 34, 33, 32, 31, 50 }},
        new ChartData { XValue = "HR", YValue = new double[] { 22, 24, 25, 30, 32, 34, 36, 38, 39, 41, 35, 36, 40, 56 } },
        new ChartData { XValue = "Finance", YValue =  new double[] { 26, 27, 28, 30, 32, 34, 35, 37, 35, 37, 45 } },
        new ChartData { XValue = "R&D", YValue = new double[] { 26, 27, 29, 32, 34, 35, 36, 37, 38, 39, 41, 43, 58 } },
        new ChartData { XValue = "Sales", YValue = new double[] { 27, 26, 28, 29, 29, 29, 32, 35, 32, 38, 53 } },
        new ChartData { XValue = "Inventory", YValue = new double[] { 21, 23, 24, 25, 26, 27, 28, 30, 34, 36, 38 } },
        new ChartData { XValue = "Graphics", YValue = new double[] { 26, 28, 29, 30, 32, 33, 35, 36, 52 } },
        new ChartData { XValue = "Training", YValue = new double[] { 28, 29, 30, 31, 32, 34, 35, 36 } }
    };
}DashArray
The DashArray property determines the pattern of dashes and gaps in the series.
@using Syncfusion.Blazor.Charts

<SfChart>
    <ChartPrimaryXAxis ValueType="Syncfusion.Blazor.Charts.ValueType.Category">
    </ChartPrimaryXAxis>

    <ChartSeriesCollection>
        <ChartSeries DataSource="@ExpenseDetails" XName="XValue" YName="YValue" Fill="blue" Opacity="0.5" DashArray="5,5" Type="Syncfusion.Blazor.Charts.ChartSeriesType.BoxAndWhisker">
        </ChartSeries>
    </ChartSeriesCollection>
</SfChart>

@code {
    public class ChartData
    {
        public string XValue { get; set; }
        public double[] YValue { get; set; }
    }

    public List<ChartData> ExpenseDetails = new List<ChartData>
    {
        new ChartData { XValue = "Development", YValue = new double[]{ 22, 22, 23, 25, 25, 25, 26, 27, 27, 28, 28, 29, 30, 32, 34, 32, 34, 36, 35, 38 } },
        new ChartData { XValue = "Testing", YValue = new double[] { 22, 33, 23, 25, 26, 28, 29, 30, 34, 33, 32, 31, 50 }},
        new ChartData { XValue = "HR", YValue = new double[] { 22, 24, 25, 30, 32, 34, 36, 38, 39, 41, 35, 36, 40, 56 } },
        new ChartData { XValue = "Finance", YValue =  new double[] { 26, 27, 28, 30, 32, 34, 35, 37, 35, 37, 45 } },
        new ChartData { XValue = "R&D", YValue = new double[] { 26, 27, 29, 32, 34, 35, 36, 37, 38, 39, 41, 43, 58 } },
        new ChartData { XValue = "Sales", YValue = new double[] { 27, 26, 28, 29, 29, 29, 32, 35, 32, 38, 53 } },
        new ChartData { XValue = "Inventory", YValue = new double[] { 21, 23, 24, 25, 26, 27, 28, 30, 34, 36, 38 } },
        new ChartData { XValue = "Graphics", YValue = new double[] { 26, 28, 29, 30, 32, 33, 35, 36, 52 } },
        new ChartData { XValue = "Training", YValue = new double[] { 28, 29, 30, 31, 32, 34, 35, 36 } }
    };
}Series Border
The ChartSeriesBorder property to customize the Width and Color of the series border.
@using Syncfusion.Blazor.Charts

<SfChart>
    <ChartPrimaryXAxis ValueType="Syncfusion.Blazor.Charts.ValueType.Category">
    </ChartPrimaryXAxis>

    <ChartSeriesCollection>
        <ChartSeries DataSource="@ExpenseDetails" XName="XValue" YName="YValue" Fill="blue" Opacity="0.5" DashArray="5,5" Type="Syncfusion.Blazor.Charts.ChartSeriesType.BoxAndWhisker">
            <ChartSeriesBorder Width="2" Color="red"></ChartSeriesBorder>
        </ChartSeries>
    </ChartSeriesCollection>
</SfChart>

@code {
    public class ChartData
    {
        public string XValue { get; set; }
        public double[] YValue { get; set; }
    }

    public List<ChartData> ExpenseDetails = new List<ChartData>
    {
        new ChartData { XValue = "Development", YValue = new double[]{ 22, 22, 23, 25, 25, 25, 26, 27, 27, 28, 28, 29, 30, 32, 34, 32, 34, 36, 35, 38 } },
        new ChartData { XValue = "Testing", YValue = new double[] { 22, 33, 23, 25, 26, 28, 29, 30, 34, 33, 32, 31, 50 }},
        new ChartData { XValue = "HR", YValue = new double[] { 22, 24, 25, 30, 32, 34, 36, 38, 39, 41, 35, 36, 40, 56 } },
        new ChartData { XValue = "Finance", YValue =  new double[] { 26, 27, 28, 30, 32, 34, 35, 37, 35, 37, 45 } },
        new ChartData { XValue = "R&D", YValue = new double[] { 26, 27, 29, 32, 34, 35, 36, 37, 38, 39, 41, 43, 58 } },
        new ChartData { XValue = "Sales", YValue = new double[] { 27, 26, 28, 29, 29, 29, 32, 35, 32, 38, 53 } },
        new ChartData { XValue = "Inventory", YValue = new double[] { 21, 23, 24, 25, 26, 27, 28, 30, 34, 36, 38 } },
        new ChartData { XValue = "Graphics", YValue = new double[] { 26, 28, 29, 30, 32, 33, 35, 36, 52 } },
        new ChartData { XValue = "Training", YValue = new double[] { 28, 29, 30, 31, 32, 34, 35, 36 } }
    };
}Box plot
To change the rendering mode of the Box and Whisker series, use the BoxPlotMode property. The default BoxPlotMode is Exclusive.
@using Syncfusion.Blazor.Charts

<SfChart>
    <ChartPrimaryXAxis ValueType="Syncfusion.Blazor.Charts.ValueType.Category">
    </ChartPrimaryXAxis>

    <ChartSeriesCollection>
        <ChartSeries DataSource="@ExpenseDetails" XName="XValue" YName="YValue" BoxPlotMode="BoxPlotMode.Normal" Type="Syncfusion.Blazor.Charts.ChartSeriesType.BoxAndWhisker">
            <ChartMarker Visible="true" Height="7" Width="7"></ChartMarker>
        </ChartSeries>
    </ChartSeriesCollection>
</SfChart>

@code {
    public class ChartData
    {
        public string XValue { get; set; }
        public double[] YValue { get; set; }
    }

    public List<ChartData> ExpenseDetails = new List<ChartData>
    {
        new ChartData { XValue = "Development", YValue = new double[]{ 22, 22, 23, 25, 25, 25, 26, 27, 27, 28, 28, 29, 30, 32, 34, 32, 34, 36, 35, 38 } },
        new ChartData { XValue = "Testing", YValue = new double[] { 22, 33, 23, 25, 26, 28, 29, 30, 34, 33, 32, 31, 50 }},
        new ChartData { XValue = "HR", YValue = new double[] { 22, 24, 25, 30, 32, 34, 36, 38, 39, 41, 35, 36, 40, 56 } },
        new ChartData { XValue = "Finance", YValue =  new double[] { 26, 27, 28, 30, 32, 34, 35, 37, 35, 37, 45 } },
        new ChartData { XValue = "R&D", YValue = new double[] { 26, 27, 29, 32, 34, 35, 36, 37, 38, 39, 41, 43, 58 } },
        new ChartData { XValue = "Sales", YValue = new double[] { 27, 26, 28, 29, 29, 29, 32, 35, 32, 38, 53 } },
        new ChartData { XValue = "Inventory", YValue = new double[] { 21, 23, 24, 25, 26, 27, 28, 30, 34, 36, 38 } },
        new ChartData { XValue = "Graphics", YValue = new double[] { 26, 28, 29, 30, 32, 33, 35, 36, 52 } },
        new ChartData { XValue = "Training", YValue = new double[] { 28, 29, 30, 31, 32, 34, 35, 36 } }
    };
}Show mean
In Box and Whisker series, ShowMean property is used to show the box and whisker average value. The default value of ShowMean is false.
@using Syncfusion.Blazor.Charts

<SfChart>
    <ChartPrimaryXAxis ValueType="Syncfusion.Blazor.Charts.ValueType.Category">
    </ChartPrimaryXAxis>

    <ChartSeriesCollection>
        <ChartSeries DataSource="@ExpenseDetails" XName="XValue" YName="YValue" Type="ChartSeriesType.BoxAndWhisker" ShowMean="false">
        </ChartSeries>
    </ChartSeriesCollection>
</SfChart>

@code{
    public class ChartData
    {
        public string XValue { get; set; }
        public double[] YValue { get; set; }
    }

    public List<ChartData> ExpenseDetails = new List<ChartData>
	{
        new ChartData { XValue = "Development", YValue = new double[]{ 22, 22, 23, 25, 25, 25, 26, 27, 27, 28, 28, 29, 30, 32, 34, 32, 34, 36, 35, 38 } },
        new ChartData { XValue = "Testing", YValue = new double[] { 22, 33, 23, 25, 26, 28, 29, 30, 34, 33, 32, 31, 50 }},
        new ChartData { XValue = "HR", YValue = new double[] { 22, 24, 25, 30, 32, 34, 36, 38, 39, 41, 35, 36, 40, 56 } },
        new ChartData { XValue = "Finance", YValue =  new double[] { 26, 27, 28, 30, 32, 34, 35, 37, 35, 37, 45 } },
        new ChartData { XValue = "R&D", YValue = new double[] { 26, 27, 29, 32, 34, 35, 36, 37, 38, 39, 41, 43, 58 } },
        new ChartData { XValue = "Sales", YValue = new double[] { 27, 26, 28, 29, 29, 29, 32, 35, 32, 38, 53 } },
        new ChartData { XValue = "Inventory", YValue = new double[] { 21, 23, 24, 25, 26, 27, 28, 30, 34, 36, 38 } },
        new ChartData { XValue = "Graphics", YValue = new double[] { 26, 28, 29, 30, 32, 33, 35, 36, 52 } },
        new ChartData { XValue = "Training", YValue = new double[] { 28, 29, 30, 31, 32, 34, 35, 36 } }
    };
}Events
Series render
The OnSeriesRender event allows you to customize series properties, such as Data, Fill, and Series, before they are rendered on the chart.
@using Syncfusion.Blazor.Charts

<SfChart>
    <ChartPrimaryXAxis ValueType="Syncfusion.Blazor.Charts.ValueType.Category">
    </ChartPrimaryXAxis>
    <ChartEvents OnSeriesRender="SeriesRender"></ChartEvents>
    <ChartSeriesCollection>
        <ChartSeries DataSource="@ExpenseDetails" XName="XValue" YName="YValue" Type="Syncfusion.Blazor.Charts.ChartSeriesType.BoxAndWhisker">
        </ChartSeries>
    </ChartSeriesCollection>
</SfChart>

@code {
    public class ChartData
    {
        public string XValue { get; set; }
        public double[] YValue { get; set; }
    }

    public void SeriesRender(SeriesRenderEventArgs args)
    {
        args.Fill = "#FF4081";
    }

    public List<ChartData> ExpenseDetails = new List<ChartData>
    {
        new ChartData { XValue = "Development", YValue = new double[]{ 22, 22, 23, 25, 25, 25, 26, 27, 27, 28, 28, 29, 30, 32, 34, 32, 34, 36, 35, 38 } },
        new ChartData { XValue = "Testing", YValue = new double[] { 22, 33, 23, 25, 26, 28, 29, 30, 34, 33, 32, 31, 50 }},
        new ChartData { XValue = "HR", YValue = new double[] { 22, 24, 25, 30, 32, 34, 36, 38, 39, 41, 35, 36, 40, 56 } },
        new ChartData { XValue = "Finance", YValue =  new double[] { 26, 27, 28, 30, 32, 34, 35, 37, 35, 37, 45 } },
        new ChartData { XValue = "R&D", YValue = new double[] { 26, 27, 29, 32, 34, 35, 36, 37, 38, 39, 41, 43, 58 } },
        new ChartData { XValue = "Sales", YValue = new double[] { 27, 26, 28, 29, 29, 29, 32, 35, 32, 38, 53 } },
        new ChartData { XValue = "Inventory", YValue = new double[] { 21, 23, 24, 25, 26, 27, 28, 30, 34, 36, 38 } },
        new ChartData { XValue = "Graphics", YValue = new double[] { 26, 28, 29, 30, 32, 33, 35, 36, 52 } },
        new ChartData { XValue = "Training", YValue = new double[] { 28, 29, 30, 31, 32, 34, 35, 36 } }
    };
}Point render
Use the OnPointRender event to customize individual points before rendering.
@using Syncfusion.Blazor.Charts

<SfChart>
    <ChartPrimaryXAxis ValueType="Syncfusion.Blazor.Charts.ValueType.Category">
    </ChartPrimaryXAxis>
    <ChartEvents OnPointRender="PointRender"></ChartEvents>
    <ChartSeriesCollection>
        <ChartSeries DataSource="@ExpenseDetails" XName="XValue" YName="YValue" Type="Syncfusion.Blazor.Charts.ChartSeriesType.BoxAndWhisker">
        </ChartSeries>
    </ChartSeriesCollection>
</SfChart>

@code {
    public class ChartData
    {
        public string XValue { get; set; }
        public double[] YValue { get; set; }
    }

    public void PointRender(PointRenderEventArgs args)
    {
        args.Fill = args.Point.X.ToString() == "R&D" ? "#E91E63" : "#3F51B5";
    }

    public List<ChartData> ExpenseDetails = new List<ChartData>
    {
        new ChartData { XValue = "Development", YValue = new double[]{ 22, 22, 23, 25, 25, 25, 26, 27, 27, 28, 28, 29, 30, 32, 34, 32, 34, 36, 35, 38 } },
        new ChartData { XValue = "Testing", YValue = new double[] { 22, 33, 23, 25, 26, 28, 29, 30, 34, 33, 32, 31, 50 }},
        new ChartData { XValue = "HR", YValue = new double[] { 22, 24, 25, 30, 32, 34, 36, 38, 39, 41, 35, 36, 40, 56 } },
        new ChartData { XValue = "Finance", YValue =  new double[] { 26, 27, 28, 30, 32, 34, 35, 37, 35, 37, 45 } },
        new ChartData { XValue = "R&D", YValue = new double[] { 26, 27, 29, 32, 34, 35, 36, 37, 38, 39, 41, 43, 58 } },
        new ChartData { XValue = "Sales", YValue = new double[] { 27, 26, 28, 29, 29, 29, 32, 35, 32, 38, 53 } },
        new ChartData { XValue = "Inventory", YValue = new double[] { 21, 23, 24, 25, 26, 27, 28, 30, 34, 36, 38 } },
        new ChartData { XValue = "Graphics", YValue = new double[] { 26, 28, 29, 30, 32, 33, 35, 36, 52 } },
        new ChartData { XValue = "Training", YValue = new double[] { 28, 29, 30, 31, 32, 34, 35, 36 } }
    };
}NOTE
Refer to our Blazor Charts feature tour page for its groundbreaking feature representations and also explore our Blazor Chart Example to know various chart types and how to represent time-dependent data, showing trends at equal intervals.