Crosshair and Trackball in Blazor Charts Component
2 Jul 202612 minutes to read
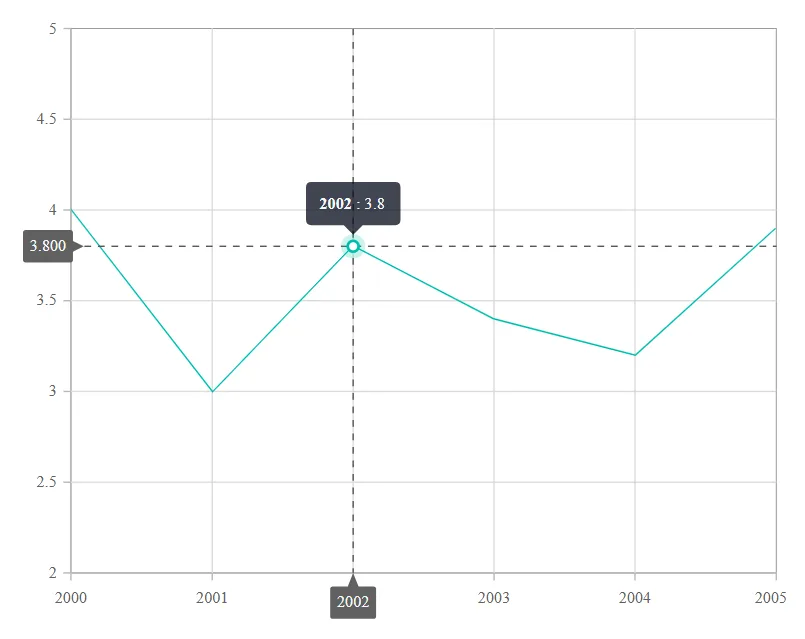
Inspect or target any data point on mouse move or touch with the help of crosshair. A thin horizontal line and vertical line indicate the data point with the information displayed in an interactive tooltip. The crosshair can be enabled using the Enable property in the ChartCrosshairSettings.
A detailed walkthrough demonstrating how to enable and customize the crosshair and trackball in Blazor Charts is presented in the video below
Enabling the SnapToData property in the crosshair aligns it with the nearest data point instead of following the exact mouse position.
@using Syncfusion.Blazor.Charts

<SfChart>
    <ChartPrimaryXAxis ValueType="Syncfusion.Blazor.Charts.ValueType.DateTime">
        <ChartAxisCrosshairTooltip Enable="true"></ChartAxisCrosshairTooltip>
    </ChartPrimaryXAxis>
    <ChartPrimaryYAxis Minimum="2" Maximum="5">
        <ChartAxisCrosshairTooltip Enable="true"></ChartAxisCrosshairTooltip>
    </ChartPrimaryYAxis>
    <ChartCrosshairSettings Enable="true" SnapToData="true" DashArray="5,5"></ChartCrosshairSettings>
    <ChartTooltipSettings Enable="true" Shared="true" Format="<b>${point.x}</b> : ${point.y}" Header="" EnableMarker="false"></ChartTooltipSettings>
    <ChartSeriesCollection>
        <ChartSeries XName="X" YName="Y" DataSource="@SalesDetails" Type="ChartSeriesType.Line">
        </ChartSeries>
    </ChartSeriesCollection>
</SfChart>

@code{
    public class ChartData
    {
        public DateTime X { get; set; }
        public double Y { get; set; }
    }

    public List<ChartData> SalesDetails = new List<ChartData>
	{
        new ChartData { X = new DateTime(2000, 01, 01), Y = 4  },
        new ChartData { X = new DateTime(2001, 01, 01), Y = 3.0 },
        new ChartData { X = new DateTime(2002, 01, 01), Y = 3.8 },
        new ChartData { X = new DateTime(2003, 01, 01), Y = 3.4 },
        new ChartData { X = new DateTime(2004, 01, 01), Y = 3.2 },
        new ChartData { X = new DateTime(2005, 01, 01), Y = 3.9 },
    };
}
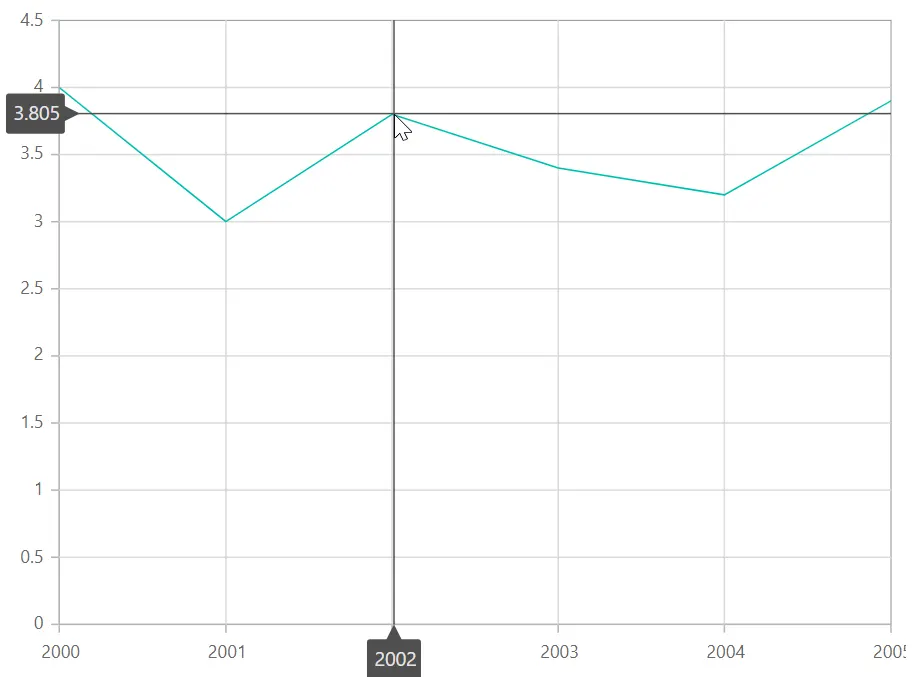
Enable Tooltip
The Enable property of ChartAxisCrosshairTooltip in the corresponding axis can be set to true, to enable the tooltip for that axis.
@using Syncfusion.Blazor.Charts

<SfChart>
    <ChartPrimaryXAxis ValueType="Syncfusion.Blazor.Charts.ValueType.DateTime">
        <ChartAxisCrosshairTooltip Enable="true"></ChartAxisCrosshairTooltip>
    </ChartPrimaryXAxis>

    <ChartCrosshairSettings Enable="true"></ChartCrosshairSettings>

    <ChartPrimaryYAxis>
        <ChartAxisCrosshairTooltip Enable="true"></ChartAxisCrosshairTooltip>
    </ChartPrimaryYAxis>

    <ChartSeriesCollection>
        <ChartSeries DataSource="@SalesDetails" XName="X" YName="Y" Type="ChartSeriesType.Line">
        </ChartSeries>
    </ChartSeriesCollection>
</SfChart>

@code{
    public class ChartData
    {
        public DateTime X { get; set; }
        public double Y { get; set; }
    }

    public List<ChartData> SalesDetails = new List<ChartData>
	{
        new ChartData { X = new DateTime(2000, 01, 01), Y = 4  },
        new ChartData { X = new DateTime(2001, 01, 01), Y = 3.0 },
        new ChartData { X = new DateTime(2002, 01, 01), Y = 3.8 },
        new ChartData { X = new DateTime(2003, 01, 01), Y = 3.4 },
        new ChartData { X = new DateTime(2004, 01, 01), Y = 3.2 },
        new ChartData { X = new DateTime(2005, 01, 01), Y = 3.9 },
    };
}
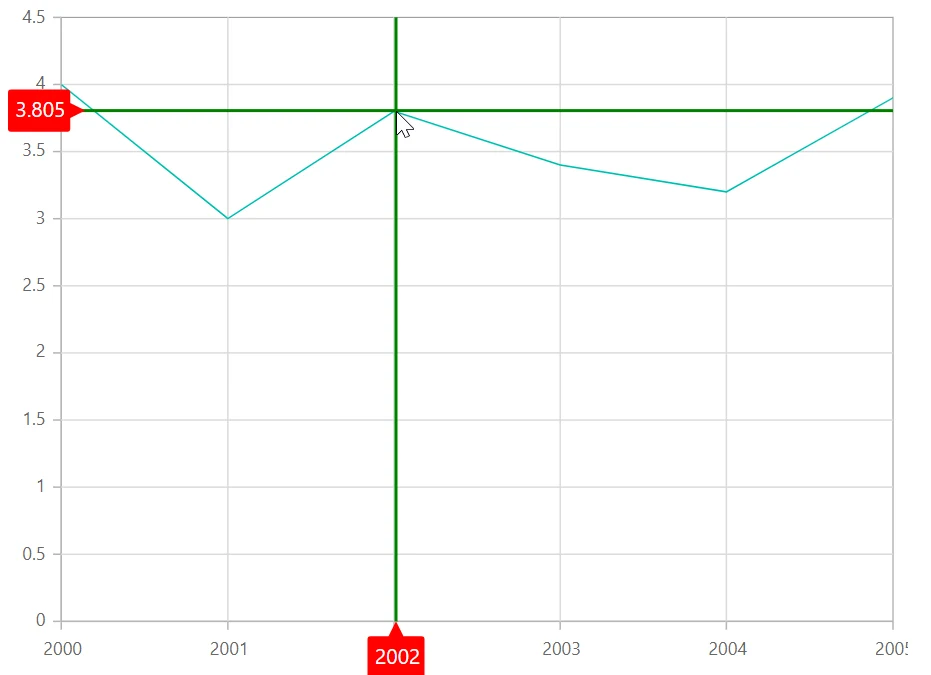
Crosshair customization
The Fill and ChartCrosshairTextStyle of the ChartAxisCrosshairTooltip are used to customize the background color and text style of the crosshair tooltip. The color and width of the crosshair line can be customized using the ChartCrosshairLine of ChartCrosshairSettings.
@using Syncfusion.Blazor.Charts

<SfChart>
    <ChartPrimaryXAxis ValueType="Syncfusion.Blazor.Charts.ValueType.DateTime">
        <ChartAxisCrosshairTooltip Enable="true" Fill="red">
            <ChartCrosshairTextStyle Size="14px" Color="white"> </ChartCrosshairTextStyle>
        </ChartAxisCrosshairTooltip>
    </ChartPrimaryXAxis>

    <ChartPrimaryYAxis>
        <ChartAxisCrosshairTooltip Enable="true" Fill="red">
            <ChartCrosshairTextStyle Size="14px" Color="white"> </ChartCrosshairTextStyle>
        </ChartAxisCrosshairTooltip>
    </ChartPrimaryYAxis>

    <ChartCrosshairSettings Enable="true">
        <ChartCrosshairLine Width="2" Color="green"></ChartCrosshairLine>
    </ChartCrosshairSettings>

    <ChartSeriesCollection>
        <ChartSeries DataSource="@SalesDetails" XName="X" YName="Y" Type="ChartSeriesType.Line">
        </ChartSeries>
    </ChartSeriesCollection>
</SfChart>

@code{
    public class ChartData
    {
        public DateTime X { get; set; }
        public double Y { get; set; }
    }

    public List<ChartData> SalesDetails = new List<ChartData>
	{
        new ChartData { X = new DateTime(2000, 01, 01), Y = 4  },
        new ChartData { X = new DateTime(2001, 01, 01), Y = 3.0 },
        new ChartData { X = new DateTime(2002, 01, 01), Y = 3.8 },
        new ChartData { X = new DateTime(2003, 01, 01), Y = 3.4 },
        new ChartData { X = new DateTime(2004, 01, 01), Y = 3.2 },
        new ChartData { X = new DateTime(2005, 01, 01), Y = 3.9 },
    };
}
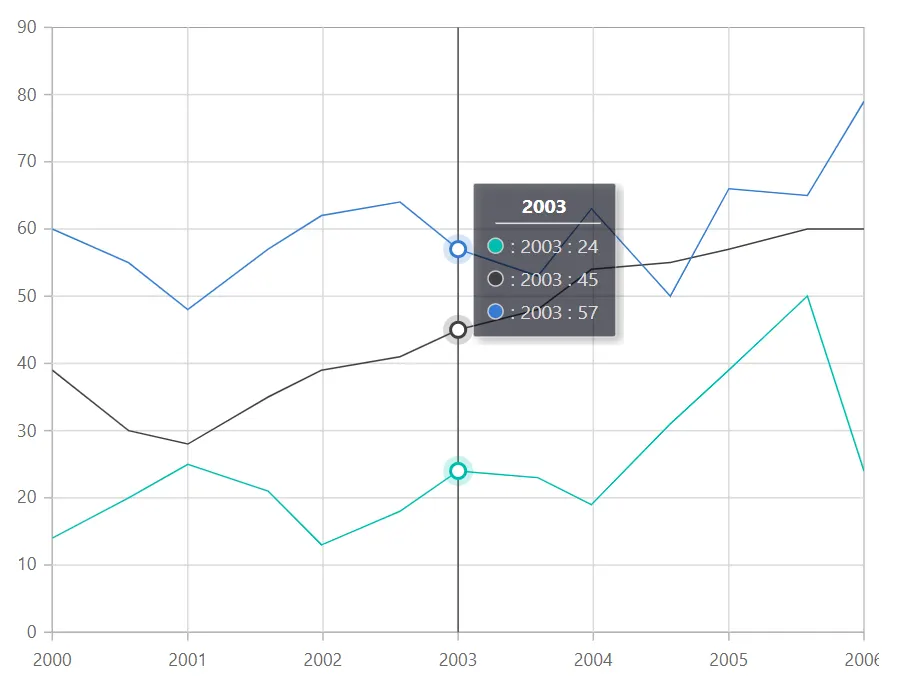
Trackball
The trackball is used to track the data point that is closest to the mouse or touch position. The closest point is indicated by a trackball marker, and the information about the point is displayed via a trackball tooltip. Trackball can be enabled by setting the Enable property of the ChartCrosshairSettings to true and Shared property in Tooltip to true in the chart.
@using Syncfusion.Blazor.Charts

<SfChart>
    <ChartPrimaryXAxis ValueType="Syncfusion.Blazor.Charts.ValueType.DateTime">
    </ChartPrimaryXAxis>

    <ChartCrosshairSettings Enable="true" LineType="LineType.Vertical"></ChartCrosshairSettings>

    <ChartTooltipSettings Enable="true" Shared="true" Format="${series.name} : ${point.x} : ${point.y}"></ChartTooltipSettings>

    <ChartSeriesCollection>
        <ChartSeries DataSource="@SalesDetails" XName="XValue" YName="YValue" Type="ChartSeriesType.Line">
        </ChartSeries>
        <ChartSeries DataSource="@SalesDetails" XName="XValue" YName="YValue1" Type="ChartSeriesType.Line">
        </ChartSeries>
        <ChartSeries DataSource="@SalesDetails" XName="XValue" YName="YValue2" Type="ChartSeriesType.Line">
        </ChartSeries>
    </ChartSeriesCollection>
</SfChart>

@code{
    public class ChartData
    {
        public DateTime XValue { get; set; }
        public double YValue { get; set; }
        public double YValue1 { get; set; }
        public double YValue2 { get; set; }
    }

    public List<ChartData> SalesDetails = new List<ChartData>
	{
        new ChartData { XValue = new DateTime(2000, 2, 11), YValue = 14, YValue1 = 39, YValue2 = 60 },
        new ChartData { XValue = new DateTime(2000, 9, 4), YValue = 20, YValue1 = 30, YValue2 = 55 },
        new ChartData { XValue = new DateTime(2001, 2, 11), YValue = 25, YValue1 = 28, YValue2 = 48 },
        new ChartData { XValue = new DateTime(2001, 9, 16), YValue = 21, YValue1 = 35, YValue2 = 57 },
        new ChartData { XValue = new DateTime(2002, 2, 7), YValue = 13, YValue1 = 39, YValue2 = 62 },
        new ChartData { XValue = new DateTime(2002, 9, 7), YValue = 18, YValue1 = 41, YValue2 = 64 },
        new ChartData { XValue = new DateTime(2003, 2, 11), YValue = 24, YValue1 = 45, YValue2 = 57 },
        new ChartData { XValue = new DateTime(2003, 9, 14), YValue = 23, YValue1 = 48, YValue2 = 53 },
        new ChartData { XValue = new DateTime(2004, 2, 6), YValue = 19, YValue1 = 54, YValue2 = 63 },
        new ChartData { XValue = new DateTime(2004, 9, 6), YValue = 31, YValue1 = 55, YValue2 = 50 },
        new ChartData { XValue = new DateTime(2005, 2, 11), YValue = 39, YValue1 = 57, YValue2 = 66 },
        new ChartData { XValue = new DateTime(2005, 9, 11), YValue = 50, YValue1 = 60, YValue2 = 65 },
        new ChartData { XValue = new DateTime(2006, 2, 11), YValue = 24, YValue1 = 60, YValue2 = 79 },
    };
}
Highlighting data range with crosshair
The HighlightCategory property in ChartCrosshairSettings enhances data visualization by highlighting the entire range of the corresponding category’s data point when hovered over. This feature aids in trend analysis across multiple data points, especially in time series or category axis charts, making comparisons clearer and more visually distinct.
@using Syncfusion.Blazor.Charts

<SfChart Title="Unemployment Rates 1975-2010">
    <ChartPrimaryXAxis ValueType="Syncfusion.Blazor.Charts.ValueType.Category">
        <ChartAxisMajorGridLines Width="0"></ChartAxisMajorGridLines>
        <ChartAxisMajorTickLines Width="0"></ChartAxisMajorTickLines>
    </ChartPrimaryXAxis>
    <ChartPrimaryYAxis>
        <ChartAxisLineStyle Width="0"></ChartAxisLineStyle>
        <ChartAxisMajorTickLines Width="0"></ChartAxisMajorTickLines>
    </ChartPrimaryYAxis>
    <ChartCrosshairSettings Enable="true" LineType="LineType.Vertical" HighlightCategory="true"></ChartCrosshairSettings>
    <ChartTooltipSettings Enable="true" Shared="true" Format="${series.name} : ${point.x} : ${point.y}"></ChartTooltipSettings>
    <ChartSeriesCollection>
        <ChartSeries DataSource="StepChartValues" Type="Syncfusion.Blazor.Charts.ChartSeriesType.Line" XName="Year" YName="Y" Name="China">
            <ChartMarker Visible="true" Width="10" Height="10">
            </ChartMarker>
        </ChartSeries>
        <ChartSeries DataSource="StepChartValues" Type="Syncfusion.Blazor.Charts.ChartSeriesType.Line" XName="Year" YName="Y1" Name="Australia">
            <ChartMarker Visible="true" Width="10" Height="10">
            </ChartMarker>
        </ChartSeries>
        <ChartSeries DataSource="StepChartValues" Type="Syncfusion.Blazor.Charts.ChartSeriesType.Line" XName="Year" YName="Y2" Name="Japan">
            <ChartMarker Visible="true" Width="10" Height="10">
            </ChartMarker>
        </ChartSeries>
    </ChartSeriesCollection>
</SfChart>

@code {
    public List<StepChartData> StepChartValues = new List<StepChartData>
    {
        new StepChartData { Year = "1975", Y = 16, Y1 = 10, Y2 = 4.5 },
        new StepChartData { Year = "1980", Y = 12.5, Y1 = 7.5, Y2 = 5},
        new StepChartData { Year = "1985", Y = 19, Y1 = 11, Y2 = 6.5 },
        new StepChartData { Year = "1990", Y = 14.4, Y1 = 7, Y2 = 4.4 },
        new StepChartData { Year = "1995", Y = 11.5, Y1 = 8, Y2 = 5 },
        new StepChartData { Year = "2000", Y = 14, Y1 = 6, Y2 = 1.5 },
        new StepChartData { Year = "2005", Y = 10, Y1 = 3.5, Y2 = 2.5 },
        new StepChartData { Year = "2010", Y = 16, Y1 = 7, Y2 = 3.7 }
    };

    public class StepChartData
    {
        public string Year { get; set; }
        public double Y { get; set; }
        public double Y1 { get; set; }
        public double Y2 { get; set; }
    }
}
NOTE
Refer to the Blazor Charts feature tour page for its groundbreaking feature representations and also explore the Blazor Chart Example to know various chart types and how to represent time-dependent data, showing trends at equal intervals.