How can I help you?
Last Data Label in Blazor Charts Component
4 Feb 20265 minutes to read
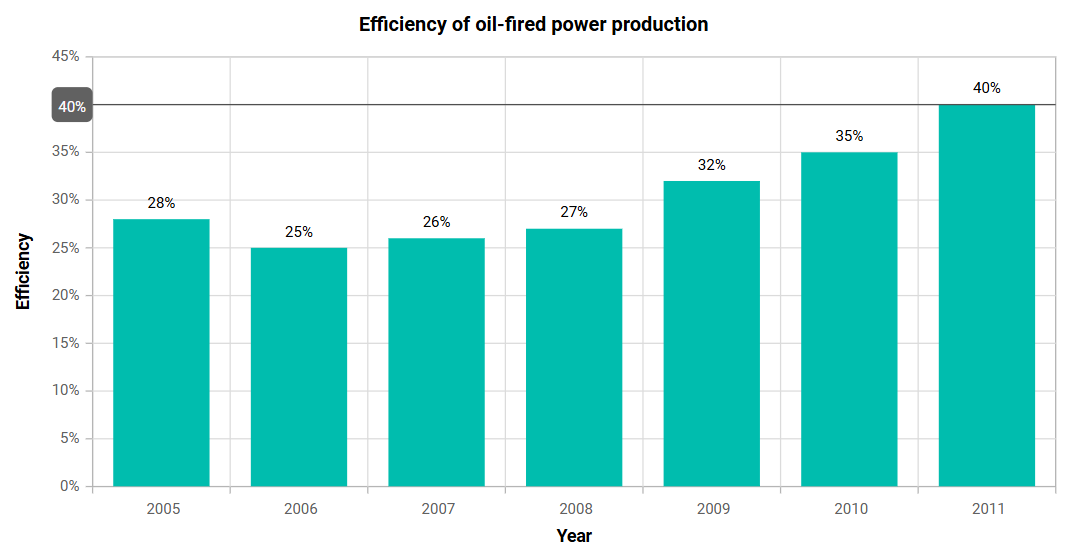
The last data label feature highlights the most recent data point in a series by displaying a label along with an indicator line. This enhancement improves visibility and makes it easier to identify the latest value in the chart. The label can be enabled and customized using the ChartLastDataLabel property.
Enable last data label
To enable the last data label, set the ShowLabel property of the ChartLastDataLabel configuration to true within the series settings.
@using Syncfusion.Blazor.Charts

<SfChart Title="Efficiency of oil-fired power production" Width="70%">
    <ChartPrimaryXAxis ValueType="Syncfusion.Blazor.Charts.ValueType.Category" Title="Year"></ChartPrimaryXAxis>
    <ChartPrimaryYAxis Title="Efficiency" LabelFormat="{value}%"></ChartPrimaryYAxis>
    <ChartTooltipSettings Enable="true"></ChartTooltipSettings>
    <ChartSeriesCollection>
        <ChartSeries DataSource="@ProductionDetails" XName="X" YName="Y" Type="Syncfusion.Blazor.Charts.ChartSeriesType.Column">
            <ChartLastDataLabel ShowLabel="true"></ChartLastDataLabel>
            <ChartMarker>
                <ChartDataLabel Visible="true"></ChartDataLabel>
            </ChartMarker>
        </ChartSeries>
    </ChartSeriesCollection>
</SfChart>

@code {
    public class ChartData
    {
        public string X { get; set; }
        public double Y { get; set; }
    }

    public List<ChartData> ProductionDetails = new List<ChartData>
    {
        new ChartData { X = "2005", Y = 28 },
        new ChartData { X = "2006", Y = 25 },
        new ChartData { X = "2007", Y = 26 },
        new ChartData { X = "2008", Y = 27 },
        new ChartData { X = "2009", Y = 32 },
        new ChartData { X = "2010", Y = 35 },
        new ChartData { X = "2011", Y = 40 }
    };
}
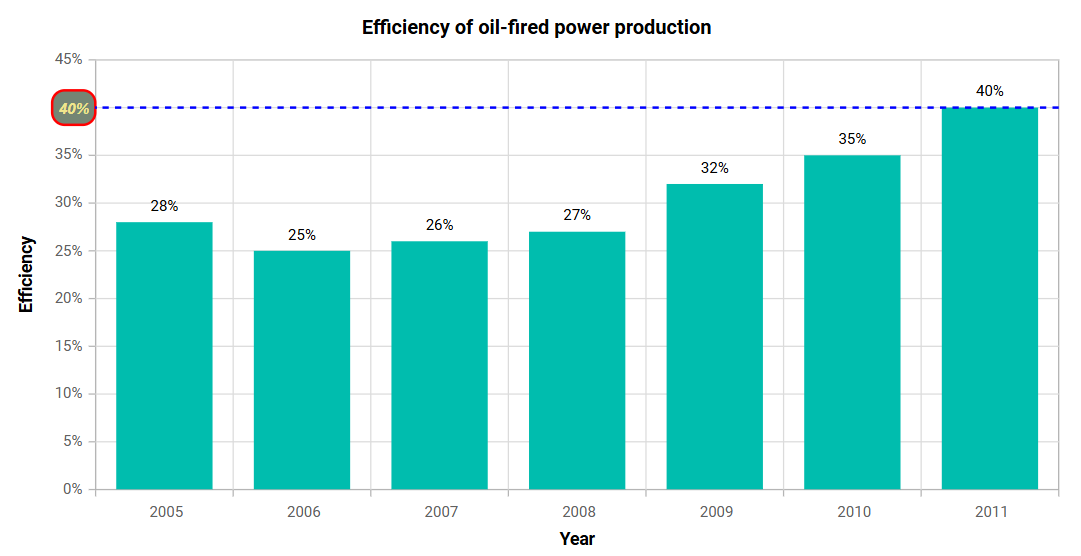
Customization
The appearance of the last data label can be customized using the following properties.
In the ChartLastDataLabel:
- Background: Sets the background color of the last data label container.
- LineColor: Sets the color of the indicator line.
- LineWidth: Sets the width of the indicator line.
- DashArray: Defines the dash pattern of the indicator line.
- Rx: Sets the horizontal corner radius of the label container.
- Ry: Sets the vertical corner radius of the label container.
In the ChartLastDataLabelBorder:
- Color: Sets the border color of the label container.
- Width: Sets the border width of the label container.
In the ChartLastDataLabelFont:
- Size: Sets the font size of the label text.
- Color: Sets the font color of the label text.
- FontFamily: Specifies the font family of the label text.
- FontWeight: Sets the font weight of the label text.
- FontStyle: Sets the font style of the label text.
@using Syncfusion.Blazor.Charts

<SfChart Title="Efficiency of oil-fired power production" Width="70%">
    <ChartPrimaryXAxis ValueType="Syncfusion.Blazor.Charts.ValueType.Category" Title="Year"></ChartPrimaryXAxis>
    <ChartPrimaryYAxis Title="Efficiency" LabelFormat="{value}%"></ChartPrimaryYAxis>
    <ChartTooltipSettings Enable="true"></ChartTooltipSettings>
    <ChartSeriesCollection>
        <ChartSeries DataSource="@ProductionDetails" XName="X" YName="Y" Type="Syncfusion.Blazor.Charts.ChartSeriesType.Column">
            <ChartLastDataLabel ShowLabel="true" Background="#748574" LineColor="blue" LineWidth="2" DashArray="5" Rx="10" Ry="10">
                <ChartLastDataLabelBorder Color="red" Width="2"></ChartLastDataLabelBorder>
                <ChartLastDataLabelFont Color="#F0E68C" FontFamily="Arial" FontStyle="Italic" FontWeight="bold" Size="12px"></ChartLastDataLabelFont>
            </ChartLastDataLabel>
            <ChartMarker>
                <ChartDataLabel Visible="true"></ChartDataLabel>
            </ChartMarker>
        </ChartSeries>
    </ChartSeriesCollection>
</SfChart>

@code {
    public class ChartData
    {
        public string X { get; set; }
        public double Y { get; set; }
    }

    public List<ChartData> ProductionDetails = new List<ChartData>
    {
        new ChartData { X = "2005", Y = 28 },
        new ChartData { X = "2006", Y = 25 },
        new ChartData { X = "2007", Y = 26 },
        new ChartData { X = "2008", Y = 27 },
        new ChartData { X = "2009", Y = 32 },
        new ChartData { X = "2010", Y = 35 },
        new ChartData { X = "2011", Y = 40 }
    };
}
See also
NOTE
Refer to the Blazor Charts feature tour page for its groundbreaking feature representations and also explore the Blazor Chart Example to know various chart types and how to represent time-dependent data, showing trends at equal intervals.