Multiple Panes in Blazor Charts Component
28 Jul 20269 minutes to read
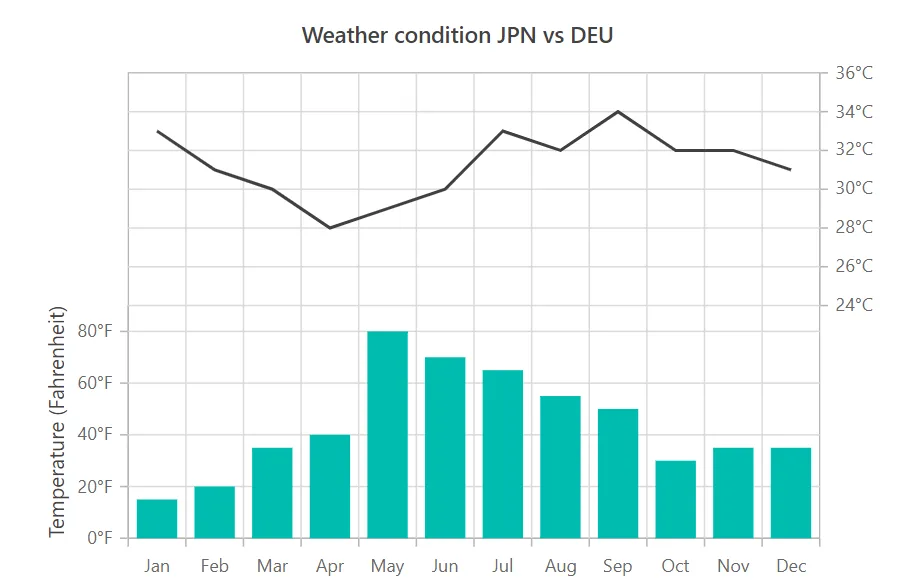
The chart area can be divided into multiple panes using Rows and Columns settings.
Rows
Use the chart’s Rows property to divide the chart area vertically into any number of rows.
-
The Height property can be used to allocate space for each row. The value can be expressed either in percentage or pixel.
-
To bind a vertical axis to a specific row, set the axis’s RowIndex property to that row’s index.
-
The bottom line of each row can be customized by specified in ChartBorder.
@using Syncfusion.Blazor.Charts

<SfChart Title="Weather condition JPN vs DEU">
    <ChartPrimaryXAxis ValueType="Syncfusion.Blazor.Charts.ValueType.Category"/>

    <ChartPrimaryYAxis Title="Temperature (Fahrenheit)" LabelFormat="{value}°F" Minimum="0" Maximum="90" Interval="20"/>

    <ChartRows>
        <ChartRow Height="50%"/>
        <ChartRow Height="50%"/>
    </ChartRows>

    <ChartAxes>
        <ChartAxis Minimum="24" Maximum="36" Interval="2" OpposedPosition="true" RowIndex="1" Name="YAxis" LabelFormat="{value}°C"/>
    </ChartAxes>

    <ChartSeriesCollection>

        <ChartSeries DataSource="@WeatherReports" XName="X" YName="Y" Type="ChartSeriesType.Column"/>

        <ChartSeries DataSource="@WeatherReports" XName="X" YName="Y1" YAxisName="YAxis"/>

    </ChartSeriesCollection>
</SfChart>

@code{
    public class ChartData
    {
        public string X { get; set; }
        public double Y { get; set; }
        public double Y1 { get; set; }
    }

	public List<ChartData> WeatherReports = new List<ChartData>
	{
		new ChartData{ X= "Jan", Y= 15, Y1= 33 },
		new ChartData{ X= "Feb", Y= 20, Y1= 31 },
		new ChartData{ X= "Mar", Y= 35, Y1= 30 },
		new ChartData{ X= "Apr", Y= 40, Y1= 28 },
		new ChartData{ X= "May", Y= 80, Y1= 29 },
		new ChartData{ X= "Jun", Y= 70, Y1= 30 },
		new ChartData{ X= "Jul", Y= 65, Y1= 33 },
		new ChartData{ X= "Aug", Y= 55, Y1= 32 },
		new ChartData{ X= "Sep", Y= 50, Y1= 34 },
		new ChartData{ X= "Oct", Y= 30, Y1= 32 },
		new ChartData{ X= "Nov", Y= 35, Y1= 32 },
		new ChartData{ X= "Dec", Y= 35, Y1= 31 }
	};
}
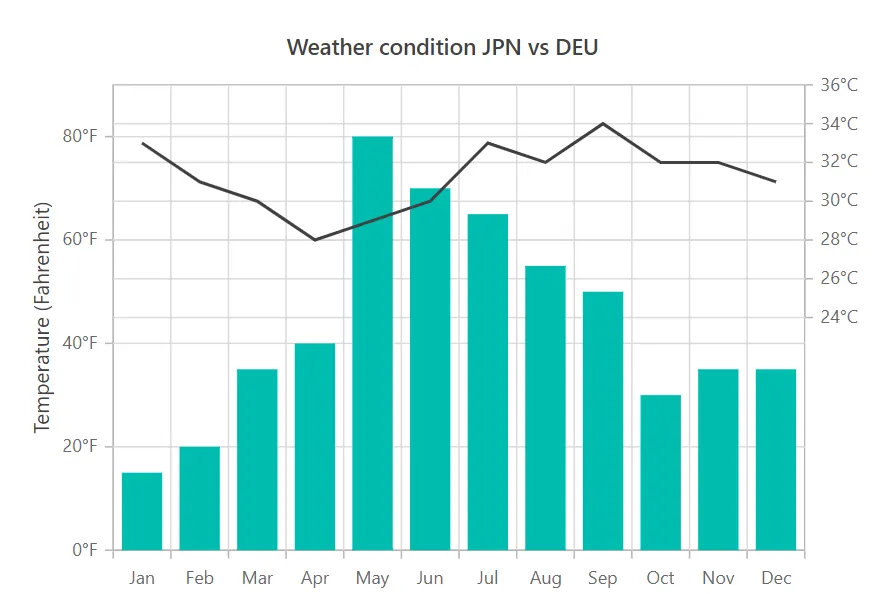
The Span property of the axis can be used to span the vertical axis across multiple rows.
@using Syncfusion.Blazor.Charts

<SfChart Title="Weather condition JPN vs DEU">
    <ChartPrimaryXAxis ValueType="Syncfusion.Blazor.Charts.ValueType.Category"/>

    <ChartPrimaryYAxis Span="2" Title="Temperature (Fahrenheit)" LabelFormat="{value}°F" Minimum="0" Maximum="90" Interval="20"/>

    <ChartRows>
        <ChartRow Height="50%"/>
        <ChartRow Height="50%"/>
    </ChartRows>

    <ChartAxes>
        <ChartAxis Minimum="24" Maximum="36" Interval="2" OpposedPosition="true" RowIndex="1" Name="YAxis" LabelFormat="{value}°C"/>
    </ChartAxes>

    <ChartSeriesCollection>

        <ChartSeries DataSource="@WeatherReports" XName="X" YName="Y" Type="ChartSeriesType.Column"/>

        <ChartSeries DataSource="@WeatherReports" XName="X" YName="Y1" YAxisName="YAxis"/>

    </ChartSeriesCollection>
</SfChart>

@code{
    public class ChartData
    {
        public string X { get; set; }
        public double Y { get; set; }
        public double Y1 { get; set; }
    }

	public List<ChartData> WeatherReports = new List<ChartData>
	{
		new ChartData{ X= "Jan", Y= 15, Y1= 33 },
		new ChartData{ X= "Feb", Y= 20, Y1= 31 },
		new ChartData{ X= "Mar", Y= 35, Y1= 30 },
		new ChartData{ X= "Apr", Y= 40, Y1= 28 },
		new ChartData{ X= "May", Y= 80, Y1= 29 },
		new ChartData{ X= "Jun", Y= 70, Y1= 30 },
		new ChartData{ X= "Jul", Y= 65, Y1= 33 },
		new ChartData{ X= "Aug", Y= 55, Y1= 32 },
		new ChartData{ X= "Sep", Y= 50, Y1= 34 },
		new ChartData{ X= "Oct", Y= 30, Y1= 32 },
		new ChartData{ X= "Nov", Y= 35, Y1= 32 },
		new ChartData{ X= "Dec", Y= 35, Y1= 31 }
	};
}
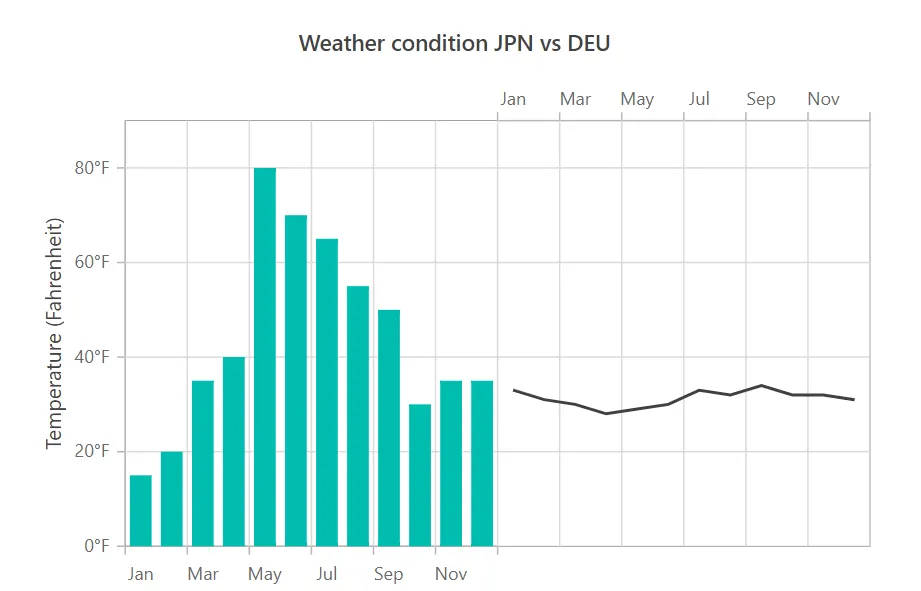
Columns
Use the chart’s Columns property to divide the chart area horizontally into any number of columns.
-
The Width property can be used to allocate space for each column. The value can be expressed either in percentage or pixel.
-
To bind a horizontal axis to a specific column, set the axis’s ColumnIndex property to that column’s index.
-
The left line of each column can be customized by specified in ChartBorder.
@using Syncfusion.Blazor.Charts

<SfChart Title="Weather condition JPN vs DEU">

    <ChartPrimaryXAxis ValueType="Syncfusion.Blazor.Charts.ValueType.Category"/>

    <ChartPrimaryYAxis Title="Temperature (Fahrenheit)" LabelFormat="{value}°F" Minimum="0" Maximum="90" Interval="20"/>

    <ChartColumns>
        <ChartColumn Width="50%"/>
        <ChartColumn Width="50%"/>
    </ChartColumns>

    <ChartAxes>
        <ChartAxis Interval="2" OpposedPosition="true" ColumnIndex="1" Name="XAxis" ValueType="Syncfusion.Blazor.Charts.ValueType.Category"/>

    </ChartAxes>

    <ChartSeriesCollection>
        <ChartSeries DataSource="@WeatherReports" XName="X" YName="Y" Type="ChartSeriesType.Column"/>
        <ChartSeries DataSource="@WeatherReports" XName="X" YName="Y1" XAxisName="XAxis" />
    </ChartSeriesCollection>
</SfChart>

@code{
    public class ChartData
    {
        public string X { get; set; }
        public double Y { get; set; }
        public double Y1 { get; set; }
    }

	public List<ChartData> WeatherReports = new List<ChartData>
	{
		new ChartData{ X= "Jan", Y= 15, Y1= 33 },
		new ChartData{ X= "Feb", Y= 20, Y1= 31 },
		new ChartData{ X= "Mar", Y= 35, Y1= 30 },
		new ChartData{ X= "Apr", Y= 40, Y1= 28 },
		new ChartData{ X= "May", Y= 80, Y1= 29 },
		new ChartData{ X= "Jun", Y= 70, Y1= 30 },
		new ChartData{ X= "Jul", Y= 65, Y1= 33 },
		new ChartData{ X= "Aug", Y= 55, Y1= 32 },
		new ChartData{ X= "Sep", Y= 50, Y1= 34 },
		new ChartData{ X= "Oct", Y= 30, Y1= 32 },
		new ChartData{ X= "Nov", Y= 35, Y1= 32 },
		new ChartData{ X= "Dec", Y= 35, Y1= 31 }
	};
}
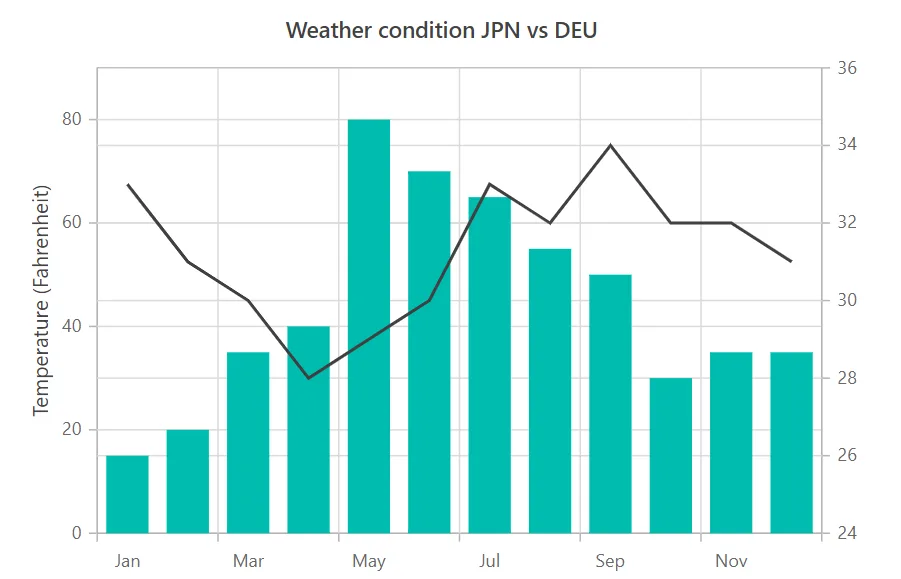
The Span property of the axis can be used to span the horizontal axis across multiple column.
@using Syncfusion.Blazor.Charts

<SfChart Title="Weather condition JPN vs DEU">

    <ChartPrimaryXAxis Span="2" ValueType="Syncfusion.Blazor.Charts.ValueType.Category"/>

    <ChartPrimaryYAxis Title="Temperature (Fahrenheit)" LabelFormat="{value}°F" Minimum="0" Maximum="90" Interval="20"/>

    <ChartColumns>
        <ChartColumn Width="50%"/>
        <ChartColumn Width="50%"/>
    </ChartColumns>

    <ChartAxes>
        <ChartAxis Interval="2" OpposedPosition="true" ColumnIndex="1" Name="XAxis" ValueType="Syncfusion.Blazor.Charts.ValueType.Category"/>

    </ChartAxes>

    <ChartSeriesCollection>
        <ChartSeries DataSource="@WeatherReports" XName="X" YName="Y" Type="ChartSeriesType.Column"/>
        <ChartSeries DataSource="@WeatherReports" XName="X" YName="Y1" XAxisName="XAxis" />
    </ChartSeriesCollection>
</SfChart>

@code{
    public class ChartData
    {
        public string X { get; set; }
        public double Y { get; set; }
        public double Y1 { get; set; }
    }

    public List<ChartData> WeatherReports = new List<ChartData>
	{
		new ChartData{ X= "Jan", Y= 15, Y1= 33 },
		new ChartData{ X= "Feb", Y= 20, Y1= 31 },
		new ChartData{ X= "Mar", Y= 35, Y1= 30 },
		new ChartData{ X= "Apr", Y= 40, Y1= 28 },
		new ChartData{ X= "May", Y= 80, Y1= 29 },
		new ChartData{ X= "Jun", Y= 70, Y1= 30 },
		new ChartData{ X= "Jul", Y= 65, Y1= 33 },
		new ChartData{ X= "Aug", Y= 55, Y1= 32 },
		new ChartData{ X= "Sep", Y= 50, Y1= 34 },
		new ChartData{ X= "Oct", Y= 30, Y1= 32 },
		new ChartData{ X= "Nov", Y= 35, Y1= 32 },
		new ChartData{ X= "Dec", Y= 35, Y1= 31 }
	};
}
NOTE
Refer to the Blazor Charts feature tour page for its groundbreaking feature representations and also explore the Blazor Chart Example to know various chart types and how to represent time-dependent data, showing trends at equal intervals.