Trendlines in Blazor Charts Component
18 Jun 202624 minutes to read
Trendlines are used to show the price’s direction and pace. Except for bar series, trendlines can be generated for Cartesian series like Line, Column, Scatter, Area, Candle, Hilo, and so on. In addition, a series can have multiple trendlines. There are six different types of trendlines that can be used on the chart. They are as follows:
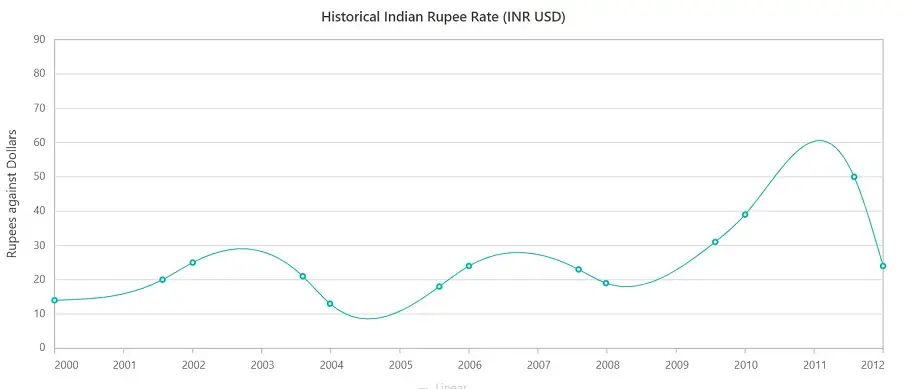
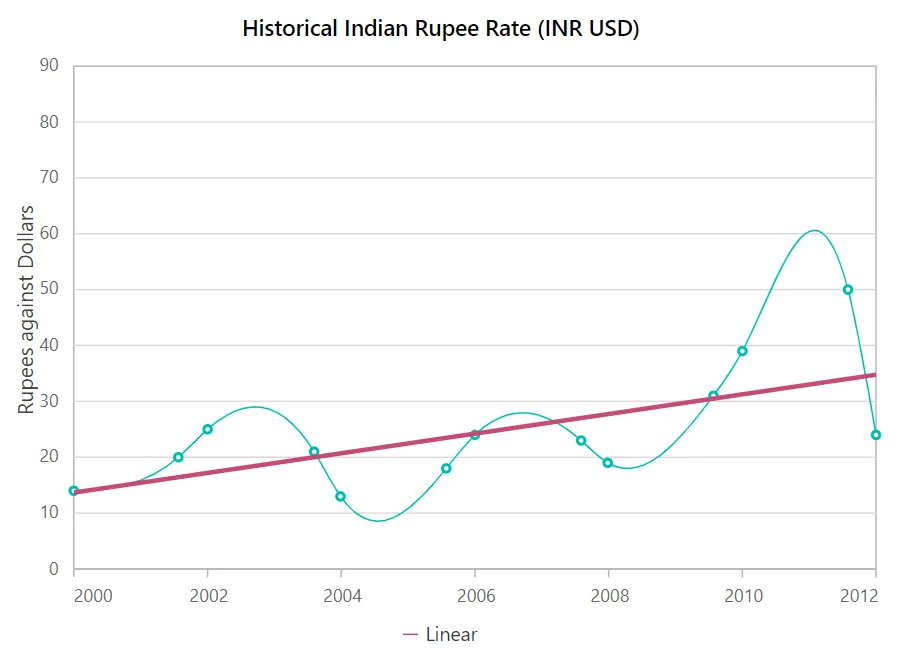
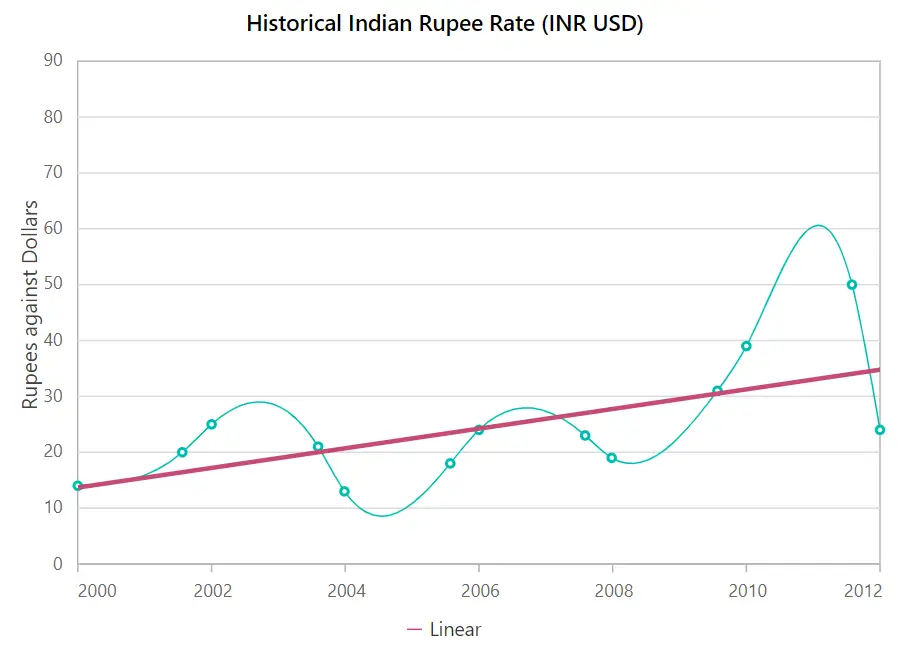
Linear
A linear trendline is a best-fit straight line used with simpler data sets. To render a linear trendline, set the Type property to Linear.
@using Syncfusion.Blazor.Charts

<SfChart Title="Historical Indian Rupee Rate (INR USD)">
    <ChartPrimaryXAxis LabelFormat="yyyy" ValueType="Syncfusion.Blazor.Charts.ValueType.DateTime" EdgeLabelPlacement="EdgeLabelPlacement.Shift">
        <ChartAxisMajorGridLines Width="0"></ChartAxisMajorGridLines>
    </ChartPrimaryXAxis>

    <ChartPrimaryYAxis Title="Rupees against Dollars">
        <ChartAxisLineStyle Width="0"></ChartAxisLineStyle>
        <ChartAxisMajorTickLines Width="0"></ChartAxisMajorTickLines>
    </ChartPrimaryYAxis>

    <ChartSeriesCollection>
        <ChartSeries DataSource="@Data" XName="XValue" YName="YValue" Type="ChartSeriesType.Spline">
            <ChartMarker Visible="true">
            </ChartMarker>
            <ChartTrendlines>
                <ChartTrendline Type="TrendlineTypes.Linear" Width="3" Name="Linear" Fill="#C64A75">
                </ChartTrendline>
            </ChartTrendlines>
        </ChartSeries>
    </ChartSeriesCollection>
</SfChart>

@code{
    public class ChartData
    {
        public DateTime XValue { get; set; }
        public double YValue { get; set; }
    }

    public List<ChartData> Data = new List<ChartData>
	{
        new ChartData { XValue = new DateTime(2000, 2, 11), YValue = 14 },
        new ChartData { XValue = new DateTime(2001, 9, 4), YValue = 20 },
        new ChartData { XValue = new DateTime(2002, 2, 11), YValue = 25 },
        new ChartData { XValue = new DateTime(2003, 9, 16), YValue = 21 },
        new ChartData { XValue = new DateTime(2004, 2, 7), YValue = 13},
        new ChartData { XValue = new DateTime(2005, 9, 7), YValue = 18 },
        new ChartData { XValue = new DateTime(2006, 2, 11), YValue = 24 },
        new ChartData { XValue = new DateTime(2007, 9, 14), YValue = 23 },
        new ChartData { XValue = new DateTime(2008, 2, 6), YValue = 19 },
        new ChartData { XValue = new DateTime(2009, 9, 6), YValue = 31 },
        new ChartData { XValue = new DateTime(2010, 2, 11), YValue = 39},
        new ChartData { XValue = new DateTime(2011, 9, 11), YValue = 50 },
        new ChartData { XValue = new DateTime(2012, 2, 11), YValue = 24 },
    };
}
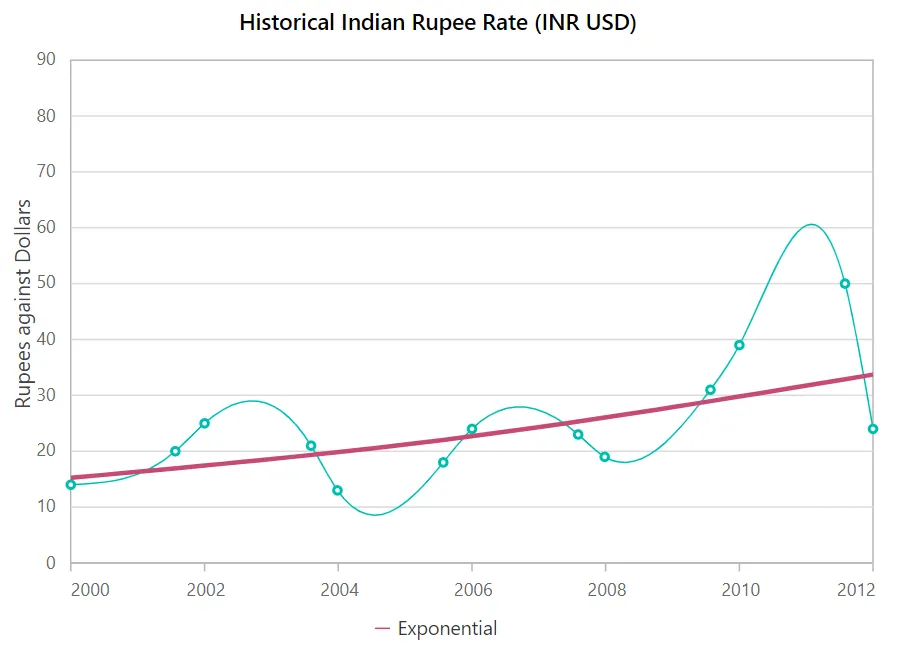
Exponential
Exponential trendline is a curved line that is most useful when data values rise or fall at increasingly higher rates. If the data contains zero or negative values, an exponential trendline cannot be created. To render a exponential trendline, set the Type property to Exponential.
@using Syncfusion.Blazor.Charts

<SfChart Title="Historical Indian Rupee Rate (INR USD)">
    <ChartPrimaryXAxis LabelFormat="yyyy" ValueType="Syncfusion.Blazor.Charts.ValueType.DateTime" EdgeLabelPlacement="EdgeLabelPlacement.Shift">
        <ChartAxisMajorGridLines Width="0"></ChartAxisMajorGridLines>
    </ChartPrimaryXAxis>

    <ChartPrimaryYAxis Title="Rupees against Dollars">
        <ChartAxisLineStyle Width="0"></ChartAxisLineStyle>
        <ChartAxisMajorTickLines Width="0"></ChartAxisMajorTickLines>
    </ChartPrimaryYAxis>

    <ChartSeriesCollection>
        <ChartSeries DataSource="@Data" XName="XValue" YName="YValue" Type="ChartSeriesType.Spline">
            <ChartMarker Visible="true">
            </ChartMarker>
            <ChartTrendlines>
                <ChartTrendline Type="TrendlineTypes.Exponential" Width="3" Name="Exponential" Fill="#C64A75">
                </ChartTrendline>
            </ChartTrendlines>
        </ChartSeries>
    </ChartSeriesCollection>
</SfChart>

@code{
    public class ChartData
    {
        public DateTime XValue { get; set; }
        public double YValue { get; set; }
    }

    public List<ChartData> Data = new List<ChartData>
	{
        new ChartData { XValue = new DateTime(2000, 2, 11), YValue = 14 },
        new ChartData { XValue = new DateTime(2001, 9, 4), YValue = 20 },
        new ChartData { XValue = new DateTime(2002, 2, 11), YValue = 25 },
        new ChartData { XValue = new DateTime(2003, 9, 16), YValue = 21 },
        new ChartData { XValue = new DateTime(2004, 2, 7), YValue = 13},
        new ChartData { XValue = new DateTime(2005, 9, 7), YValue = 18 },
        new ChartData { XValue = new DateTime(2006, 2, 11), YValue = 24 },
        new ChartData { XValue = new DateTime(2007, 9, 14), YValue = 23 },
        new ChartData { XValue = new DateTime(2008, 2, 6), YValue = 19 },
        new ChartData { XValue = new DateTime(2009, 9, 6), YValue = 31 },
        new ChartData { XValue = new DateTime(2010, 2, 11), YValue = 39},
        new ChartData { XValue = new DateTime(2011, 9, 11), YValue = 50 },
        new ChartData { XValue = new DateTime(2012, 2, 11), YValue = 24 },
    };
}
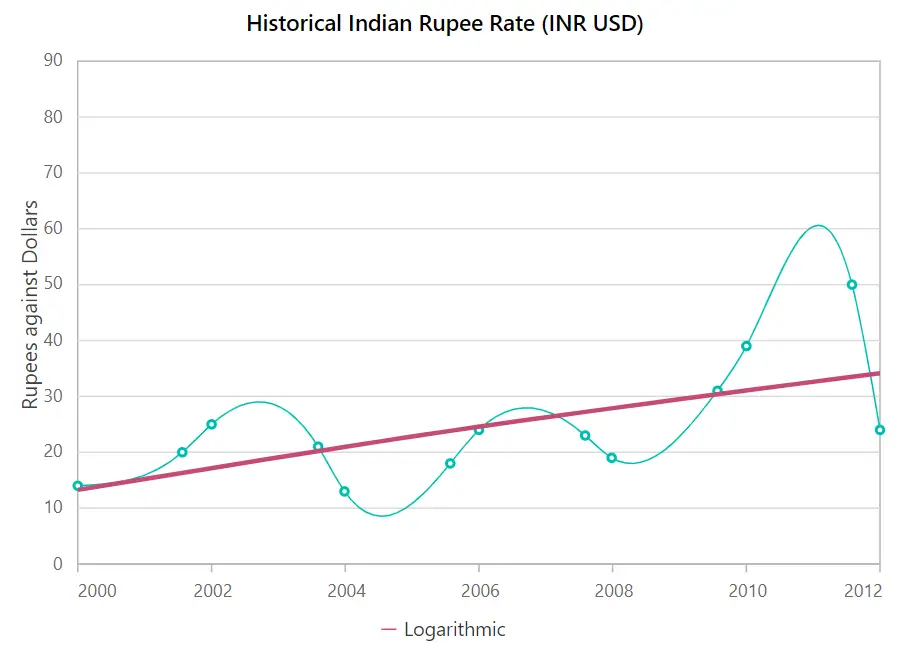
Logarithmic
A logarithmic trendline is a best-fit curved line that is most useful when the rate of change in the data increases or decreases quickly and then levels out. Negative and positive numbers can be used in a logarithmic trendline. To render a logarithmic trendline, set the Type property to Logarithmic.
@using Syncfusion.Blazor.Charts

<SfChart Title="Historical Indian Rupee Rate (INR USD)">
    <ChartPrimaryXAxis LabelFormat="yyyy" ValueType="Syncfusion.Blazor.Charts.ValueType.DateTime" EdgeLabelPlacement="EdgeLabelPlacement.Shift">
        <ChartAxisMajorGridLines Width="0"></ChartAxisMajorGridLines>
    </ChartPrimaryXAxis>

    <ChartPrimaryYAxis Title="Rupees against Dollars">
        <ChartAxisLineStyle Width="0"></ChartAxisLineStyle>
        <ChartAxisMajorTickLines Width="0"></ChartAxisMajorTickLines>
    </ChartPrimaryYAxis>

    <ChartSeriesCollection>
        <ChartSeries DataSource="@Data" XName="XValue" YName="YValue" Type="ChartSeriesType.Spline">
            <ChartMarker Visible="true">
            </ChartMarker>
            <ChartTrendlines>
                <ChartTrendline Type="TrendlineTypes.Logarithmic" Width="3" Name="Logarithmic" Fill="#C64A75">
                </ChartTrendline>
            </ChartTrendlines>
        </ChartSeries>
    </ChartSeriesCollection>
</SfChart>

@code{
    public class ChartData
    {
        public DateTime XValue { get; set; }
        public double YValue { get; set; }
    }

    public List<ChartData> Data = new List<ChartData>
	{
        new ChartData { XValue = new DateTime(2000, 2, 11), YValue = 14 },
        new ChartData { XValue = new DateTime(2001, 9, 4), YValue = 20 },
        new ChartData { XValue = new DateTime(2002, 2, 11), YValue = 25 },
        new ChartData { XValue = new DateTime(2003, 9, 16), YValue = 21 },
        new ChartData { XValue = new DateTime(2004, 2, 7), YValue = 13},
        new ChartData { XValue = new DateTime(2005, 9, 7), YValue = 18 },
        new ChartData { XValue = new DateTime(2006, 2, 11), YValue = 24 },
        new ChartData { XValue = new DateTime(2007, 9, 14), YValue = 23 },
        new ChartData { XValue = new DateTime(2008, 2, 6), YValue = 19 },
        new ChartData { XValue = new DateTime(2009, 9, 6), YValue = 31 },
        new ChartData { XValue = new DateTime(2010, 2, 11), YValue = 39},
        new ChartData { XValue = new DateTime(2011, 9, 11), YValue = 50 },
        new ChartData { XValue = new DateTime(2012, 2, 11), YValue = 24 },
    };
}
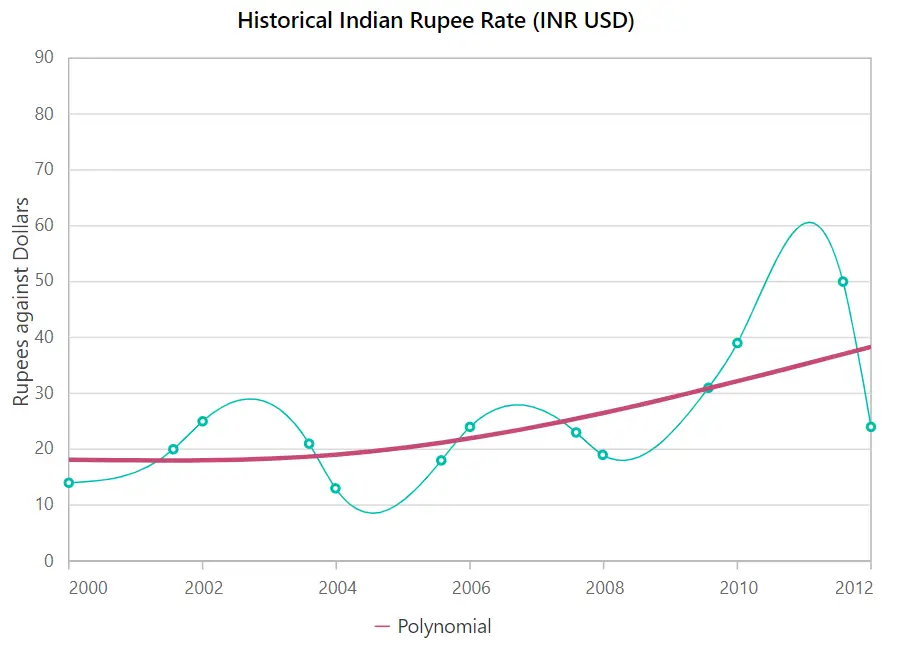
Polynomial
A polynomial trendline is a curved line that is used when data fluctuates. To render a polynomial trendline, set the Type property to Polynomial.
@using Syncfusion.Blazor.Charts

<SfChart Title="Historical Indian Rupee Rate (INR USD)">
    <ChartPrimaryXAxis LabelFormat="yyyy" ValueType="Syncfusion.Blazor.Charts.ValueType.DateTime" EdgeLabelPlacement="EdgeLabelPlacement.Shift">
        <ChartAxisMajorGridLines Width="0"></ChartAxisMajorGridLines>
    </ChartPrimaryXAxis>

    <ChartPrimaryYAxis Title="Rupees against Dollars">
        <ChartAxisLineStyle Width="0"></ChartAxisLineStyle>
        <ChartAxisMajorTickLines Width="0"></ChartAxisMajorTickLines>
    </ChartPrimaryYAxis>

    <ChartSeriesCollection>
        <ChartSeries DataSource="@Data" XName="XValue" YName="YValue" Type="ChartSeriesType.Spline">
            <ChartMarker Visible="true">
            </ChartMarker>
            <ChartTrendlines>
                <ChartTrendline Type="TrendlineTypes.Polynomial" Width="3" Name="Polynomial" Fill="#C64A75">
                </ChartTrendline>
            </ChartTrendlines>
        </ChartSeries>
    </ChartSeriesCollection>
</SfChart>

@code{
    public class ChartData
    {
        public DateTime XValue { get; set; }
        public double YValue { get; set; }
    }

    public List<ChartData> Data = new List<ChartData>
	{
        new ChartData { XValue = new DateTime(2000, 2, 11), YValue = 14 },
        new ChartData { XValue = new DateTime(2001, 9, 4), YValue = 20 },
        new ChartData { XValue = new DateTime(2002, 2, 11), YValue = 25 },
        new ChartData { XValue = new DateTime(2003, 9, 16), YValue = 21 },
        new ChartData { XValue = new DateTime(2004, 2, 7), YValue = 13},
        new ChartData { XValue = new DateTime(2005, 9, 7), YValue = 18 },
        new ChartData { XValue = new DateTime(2006, 2, 11), YValue = 24 },
        new ChartData { XValue = new DateTime(2007, 9, 14), YValue = 23 },
        new ChartData { XValue = new DateTime(2008, 2, 6), YValue = 19 },
        new ChartData { XValue = new DateTime(2009, 9, 6), YValue = 31 },
        new ChartData { XValue = new DateTime(2010, 2, 11), YValue = 39},
        new ChartData { XValue = new DateTime(2011, 9, 11), YValue = 50 },
        new ChartData { XValue = new DateTime(2012, 2, 11), YValue = 24 },
    };
}
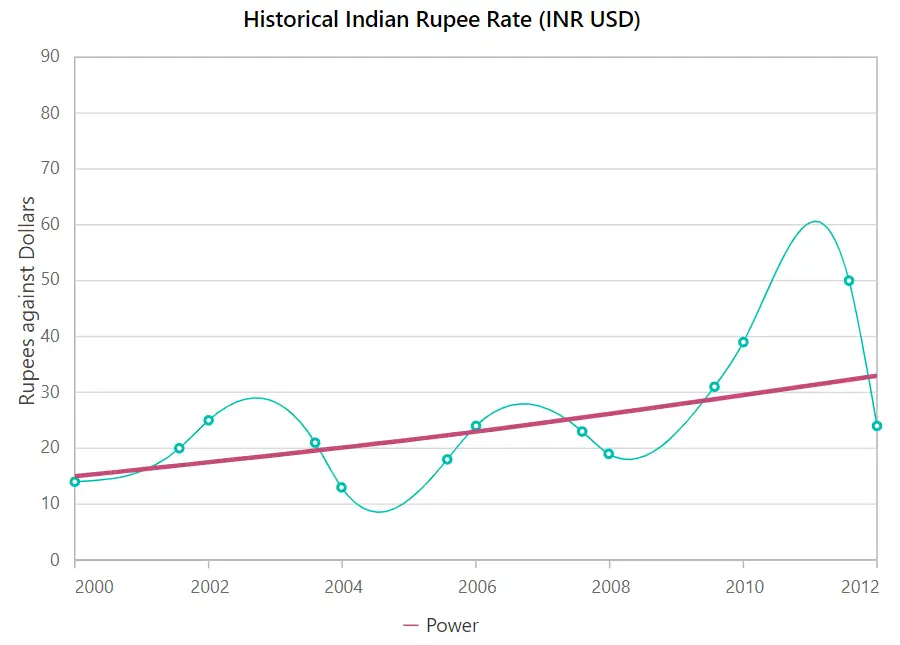
Power
A power trendline is a curved line that is best used with data sets that compare measurements that increase at a specific rate. To render a power trendline, set the Type property to Power.
@using Syncfusion.Blazor.Charts

<SfChart Title="Historical Indian Rupee Rate (INR USD)">
    <ChartPrimaryXAxis LabelFormat="yyyy" ValueType="Syncfusion.Blazor.Charts.ValueType.DateTime" EdgeLabelPlacement="EdgeLabelPlacement.Shift">
        <ChartAxisMajorGridLines Width="0"></ChartAxisMajorGridLines>
    </ChartPrimaryXAxis>

    <ChartPrimaryYAxis Title="Rupees against Dollars">
        <ChartAxisLineStyle Width="0"></ChartAxisLineStyle>
        <ChartAxisMajorTickLines Width="0"></ChartAxisMajorTickLines>
    </ChartPrimaryYAxis>

    <ChartSeriesCollection>
        <ChartSeries DataSource="@Data" XName="XValue" YName="YValue" Type="ChartSeriesType.Spline">
            <ChartMarker Visible="true">
            </ChartMarker>
            <ChartTrendlines>
                <ChartTrendline Type="TrendlineTypes.Power" Width="3" Name="Power" Fill="#C64A75">
                </ChartTrendline>
            </ChartTrendlines>
        </ChartSeries>
    </ChartSeriesCollection>
</SfChart>

@code{
    public class ChartData
    {
        public DateTime XValue { get; set; }
        public double YValue { get; set; }
    }

    public List<ChartData> Data = new List<ChartData>
	{
        new ChartData { XValue = new DateTime(2000, 2, 11), YValue = 14 },
        new ChartData { XValue = new DateTime(2001, 9, 4), YValue = 20 },
        new ChartData { XValue = new DateTime(2002, 2, 11), YValue = 25 },
        new ChartData { XValue = new DateTime(2003, 9, 16), YValue = 21 },
        new ChartData { XValue = new DateTime(2004, 2, 7), YValue = 13},
        new ChartData { XValue = new DateTime(2005, 9, 7), YValue = 18 },
        new ChartData { XValue = new DateTime(2006, 2, 11), YValue = 24 },
        new ChartData { XValue = new DateTime(2007, 9, 14), YValue = 23 },
        new ChartData { XValue = new DateTime(2008, 2, 6), YValue = 19 },
        new ChartData { XValue = new DateTime(2009, 9, 6), YValue = 31 },
        new ChartData { XValue = new DateTime(2010, 2, 11), YValue = 39},
        new ChartData { XValue = new DateTime(2011, 9, 11), YValue = 50 },
        new ChartData { XValue = new DateTime(2012, 2, 11), YValue = 24 },
    };
}
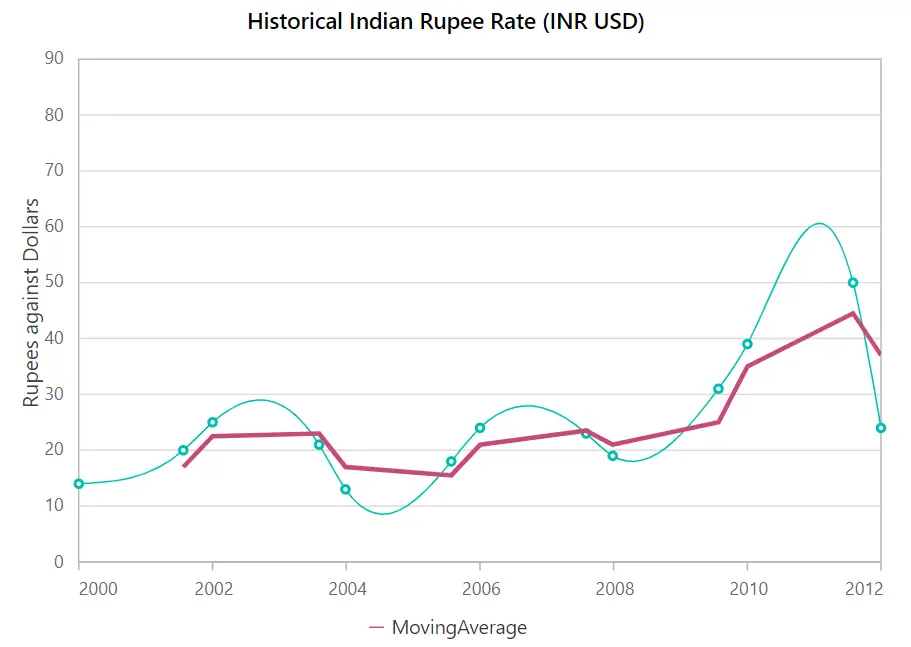
Moving Average
A moving average trendline smoothen out fluctuations in data to show a pattern or trend more clearly. To render a moving average trendline, set the Type property to MovingAverage. The Period property specifies how long the moving average should be calculated over.
@using Syncfusion.Blazor.Charts

<SfChart Title="Historical Indian Rupee Rate (INR USD)">
    <ChartPrimaryXAxis LabelFormat="yyyy" ValueType="Syncfusion.Blazor.Charts.ValueType.DateTime" EdgeLabelPlacement="EdgeLabelPlacement.Shift">
        <ChartAxisMajorGridLines Width="0"></ChartAxisMajorGridLines>
    </ChartPrimaryXAxis>

    <ChartPrimaryYAxis Title="Rupees against Dollars">
        <ChartAxisLineStyle Width="0"></ChartAxisLineStyle>
        <ChartAxisMajorTickLines Width="0"></ChartAxisMajorTickLines>
    </ChartPrimaryYAxis>

    <ChartSeriesCollection>
        <ChartSeries DataSource="@Data" XName="XValue" YName="YValue" Type="ChartSeriesType.Spline">
            <ChartMarker Visible="true">
            </ChartMarker>
            <ChartTrendlines>
                <ChartTrendline Type="TrendlineTypes.MovingAverage" Width="3" Name="MovingAverage" Fill="#C64A75">
                </ChartTrendline>
            </ChartTrendlines>
        </ChartSeries>
    </ChartSeriesCollection>
</SfChart>

@code{
    public class ChartData
    {
        public DateTime XValue { get; set; }
        public double YValue { get; set; }
    }

    public List<ChartData> Data = new List<ChartData>
	{
        new ChartData { XValue = new DateTime(2000, 2, 11), YValue = 14 },
        new ChartData { XValue = new DateTime(2001, 9, 4), YValue = 20 },
        new ChartData { XValue = new DateTime(2002, 2, 11), YValue = 25 },
        new ChartData { XValue = new DateTime(2003, 9, 16), YValue = 21 },
        new ChartData { XValue = new DateTime(2004, 2, 7), YValue = 13},
        new ChartData { XValue = new DateTime(2005, 9, 7), YValue = 18 },
        new ChartData { XValue = new DateTime(2006, 2, 11), YValue = 24 },
        new ChartData { XValue = new DateTime(2007, 9, 14), YValue = 23 },
        new ChartData { XValue = new DateTime(2008, 2, 6), YValue = 19 },
        new ChartData { XValue = new DateTime(2009, 9, 6), YValue = 31 },
        new ChartData { XValue = new DateTime(2010, 2, 11), YValue = 39},
        new ChartData { XValue = new DateTime(2011, 9, 11), YValue = 50 },
        new ChartData { XValue = new DateTime(2012, 2, 11), YValue = 24 },
    };
}
Forecasting
Trendlines forecasting is the prediction of future/past situations. There are two types of forecasting available: forward forecasting and backward forecasting.
Forward forecasting
The value set to ForwardForecast property is used to calculate the distance between the current trend and the future trend.
@using Syncfusion.Blazor.Charts

<SfChart Title="Historical Indian Rupee Rate (INR USD)">
    <ChartPrimaryXAxis LabelFormat="yyyy" ValueType="Syncfusion.Blazor.Charts.ValueType.DateTime" EdgeLabelPlacement="EdgeLabelPlacement.Shift">
        <ChartAxisMajorGridLines Width="0"></ChartAxisMajorGridLines>
    </ChartPrimaryXAxis>

    <ChartPrimaryYAxis Title="Rupees against Dollars">
        <ChartAxisLineStyle Width="0"></ChartAxisLineStyle>
        <ChartAxisMajorTickLines Width="0"></ChartAxisMajorTickLines>
    </ChartPrimaryYAxis>

    <ChartSeriesCollection>
        <ChartSeries DataSource="@Data" XName="XValue" YName="YValue" Type="ChartSeriesType.Spline">
            <ChartMarker Visible="true">
            </ChartMarker>
            <ChartTrendlines>
                <ChartTrendline Type="TrendlineTypes.Linear" Width="3" Name="Linear" Fill="#C64A75" ForwardForecast="5">
                </ChartTrendline>
            </ChartTrendlines>
        </ChartSeries>
    </ChartSeriesCollection>
</SfChart>

@code{
    public class ChartData
    {
        public DateTime XValue { get; set; }
        public double YValue { get; set; }
    }

    public List<ChartData> Data = new List<ChartData>
	{
        new ChartData { XValue = new DateTime(2000, 2, 11), YValue = 14 },
        new ChartData { XValue = new DateTime(2001, 9, 4), YValue = 20 },
        new ChartData { XValue = new DateTime(2002, 2, 11), YValue = 25 },
        new ChartData { XValue = new DateTime(2003, 9, 16), YValue = 21 },
        new ChartData { XValue = new DateTime(2004, 2, 7), YValue = 13},
        new ChartData { XValue = new DateTime(2005, 9, 7), YValue = 18 },
        new ChartData { XValue = new DateTime(2006, 2, 11), YValue = 24 },
        new ChartData { XValue = new DateTime(2007, 9, 14), YValue = 23 },
        new ChartData { XValue = new DateTime(2008, 2, 6), YValue = 19 },
        new ChartData { XValue = new DateTime(2009, 9, 6), YValue = 31 },
        new ChartData { XValue = new DateTime(2010, 2, 11), YValue = 39},
        new ChartData { XValue = new DateTime(2011, 9, 11), YValue = 50 },
        new ChartData { XValue = new DateTime(2012, 2, 11), YValue = 24 },
    };
}
Backward forecasting
The value set to BackwardForecast property is used to determine historical trends.
@using Syncfusion.Blazor.Charts

<SfChart Title="Historical Indian Rupee Rate (INR USD)">
    <ChartPrimaryXAxis LabelFormat="yyyy" ValueType="Syncfusion.Blazor.Charts.ValueType.DateTime" EdgeLabelPlacement="EdgeLabelPlacement.Shift">
        <ChartAxisMajorGridLines Width="0"></ChartAxisMajorGridLines>
    </ChartPrimaryXAxis>

    <ChartPrimaryYAxis Title="Rupees against Dollars">
        <ChartAxisLineStyle Width="0"></ChartAxisLineStyle>
        <ChartAxisMajorTickLines Width="0"></ChartAxisMajorTickLines>
    </ChartPrimaryYAxis>

    <ChartSeriesCollection>
        <ChartSeries DataSource="@Data" XName="XValue" YName="YValue" Type="ChartSeriesType.Spline">
            <ChartMarker Visible="true">
            </ChartMarker>
            <ChartTrendlines>
                <ChartTrendline Type="TrendlineTypes.Linear" Width="3" Name="Linear" Fill="#C64A75" BackwardForecast="5">
                </ChartTrendline>
            </ChartTrendlines>
        </ChartSeries>
    </ChartSeriesCollection>
</SfChart>

@code{
    public class ChartData
    {
        public DateTime XValue { get; set; }
        public double YValue { get; set; }
    }

    public List<ChartData> Data = new List<ChartData>
	{
        new ChartData { XValue = new DateTime(2000, 2, 11), YValue = 14 },
        new ChartData { XValue = new DateTime(2001, 9, 4), YValue = 20 },
        new ChartData { XValue = new DateTime(2002, 2, 11), YValue = 25 },
        new ChartData { XValue = new DateTime(2003, 9, 16), YValue = 21 },
        new ChartData { XValue = new DateTime(2004, 2, 7), YValue = 13},
        new ChartData { XValue = new DateTime(2005, 9, 7), YValue = 18 },
        new ChartData { XValue = new DateTime(2006, 2, 11), YValue = 24 },
        new ChartData { XValue = new DateTime(2007, 9, 14), YValue = 23 },
        new ChartData { XValue = new DateTime(2008, 2, 6), YValue = 19 },
        new ChartData { XValue = new DateTime(2009, 9, 6), YValue = 31 },
        new ChartData { XValue = new DateTime(2010, 2, 11), YValue = 39},
        new ChartData { XValue = new DateTime(2011, 9, 11), YValue = 50 },
        new ChartData { XValue = new DateTime(2012, 2, 11), YValue = 24 },
    };
}
Trendlines customization
The Fill and Width properties are used to customize the appearance of the trendline.
NOTE
Refer to the Blazor Charts feature tour page for its groundbreaking feature representations and also explore the Blazor Chart Example to know various chart types and how to represent time-dependent data, showing trends at equal intervals.
Show or hide a trendline
Use the trendline visible property to show or hide the trendline.
@using Syncfusion.Blazor.Charts

<SfChart Title="Historical Indian Rupee Rate (INR USD)">
    <ChartPrimaryXAxis LabelFormat="yyyy" ValueType="Syncfusion.Blazor.Charts.ValueType.DateTime" EdgeLabelPlacement="EdgeLabelPlacement.Shift">
        <ChartAxisMajorGridLines Width="0"></ChartAxisMajorGridLines>
    </ChartPrimaryXAxis>

    <ChartPrimaryYAxis Title="Rupees against Dollars">
        <ChartAxisLineStyle Width="0"></ChartAxisLineStyle>
        <ChartAxisMajorTickLines Width="0"></ChartAxisMajorTickLines>
    </ChartPrimaryYAxis>

    <ChartSeriesCollection>
        <ChartSeries DataSource="@Data" XName="XValue" YName="YValue" Type="ChartSeriesType.Spline">
            <ChartMarker Visible="true">
            </ChartMarker>
            <ChartTrendlines>
                <ChartTrendline Type="TrendlineTypes.Linear" Width="3" Name="Linear" Fill="#C64A75" Visible= "false">
                </ChartTrendline>
            </ChartTrendlines>
        </ChartSeries>
    </ChartSeriesCollection>
</SfChart>

@code{
    public class ChartData
    {
        public DateTime XValue { get; set; }
        public double YValue { get; set; }
    }

    public List<ChartData> Data = new List<ChartData>
	{
        new ChartData { XValue = new DateTime(2000, 2, 11), YValue = 14 },
        new ChartData { XValue = new DateTime(2001, 9, 4), YValue = 20 },
        new ChartData { XValue = new DateTime(2002, 2, 11), YValue = 25 },
        new ChartData { XValue = new DateTime(2003, 9, 16), YValue = 21 },
        new ChartData { XValue = new DateTime(2004, 2, 7), YValue = 13},
        new ChartData { XValue = new DateTime(2005, 9, 7), YValue = 18 },
        new ChartData { XValue = new DateTime(2006, 2, 11), YValue = 24 },
        new ChartData { XValue = new DateTime(2007, 9, 14), YValue = 23 },
        new ChartData { XValue = new DateTime(2008, 2, 6), YValue = 19 },
        new ChartData { XValue = new DateTime(2009, 9, 6), YValue = 31 },
        new ChartData { XValue = new DateTime(2010, 2, 11), YValue = 39},
        new ChartData { XValue = new DateTime(2011, 9, 11), YValue = 50 },
        new ChartData { XValue = new DateTime(2012, 2, 11), YValue = 24 },
    };
}