Integrating Blazor DataGrid with Bold Report Viewer
19 Jun 202624 minutes to read
This guide explains how to integrate the Blazor DataGrid with the Bold Report Viewer to display grid data inside RDLC reports. This enables scenarios such as exporting grid data, generating printable reports, and providing data‑driven visualizations directly from a Blazor application.
If you haven’t created your Blazor app yet, follow the Blazor getting started guide to create a project.
Install required NuGet packages
Use NuGet Package Manager (Tools → NuGet Package Manager → Manage NuGet Packages for Solution) and install the following packages:
Syncfusion packages:
Bold Reports package:
Microsoft packages:
Add required namespaces
Open the ~Components/_Imports.razor file and import the Syncfusion.Blazor, Syncfusion.Blazor.Grids, Syncfusion.Blazor.Buttons namespaces.
@using Syncfusion.Blazor
@using Syncfusion.Blazor.Grids
@using Syncfusion.Blazor.Buttons
Register Blazor service
Add the Blazor service to the ~/Program.cs file to enable Blazor components in the application.
...
using Syncfusion.Blazor;
var builder = WebApplication.CreateBuilder(args);
// Add services to the container.
builder.Services.AddSyncfusionBlazor();
builder.Services.AddControllers().AddNewtonsoftJson();
builder.Services.AddMemoryCache();
// HttpClient for server-side calls
builder.Services.AddHttpClient();
...
var app = builder.Build();
app.MapRazorComponents<App>()
    .AddInteractiveServerRenderMode();
app.MapControllers();
app.Run();
Add stylesheet and script resources
Add theme CSS and required scripts to the ~/Components/App.razor file. The Bold Report Viewer requires its specific script in addition to the core script.
<head>
     <!-- Blazor theme style sheet -->
    <link href="_content/Syncfusion.Blazor.Themes/fluent2.css" rel="stylesheet" />
    <!-- Bold Report Viewer CSS -->
    <link href="https://cdn.boldreports.com/12.2.6/content/v2.0/tailwind-light/bold.report-viewer.min.css" rel="stylesheet" />
</head>
<body>
    <!-- Blazor DataGrid component's script reference -->
    <script src="_content/Syncfusion.Blazor.Core/scripts/syncfusion-blazor.min.js"></script>
    <!-- Blazor Bold Report Viewer script reference-->
    <script src="https://cdnjs.cloudflare.com/ajax/libs/jquery/3.6.0/jquery.min.js"></script>
    <script src="https://cdn.boldreports.com/12.2.6/scripts/v2.0/common/bold.reports.common.min.js"></script>
    <script src="https://cdn.boldreports.com/12.2.6/scripts/v2.0/common/bold.reports.widgets.min.js"></script>
    <script src="https://cdn.boldreports.com/12.2.6/scripts/v2.0/bold.report-viewer.min.js"></script>
    <!-- Interop -->
    <script src="@Assets["scripts/boldreports-interop.js"]" ></script>
</body>
Add a sample report
Create interop file
Create an interop JS (in this example used as bold-reports-interop.js file name) inside the wwwroot/scripts folder and use the following code snippet to invoke the Bold Report Viewer.
window.BoldReports = {
    renderViewer: function (elementId, options) {
        $("#" + elementId).boldReportViewer({
            reportServiceUrl: options.serviceUrl,
            processingMode: "Local",
            reportPath: options.reportPath
        });
    },
    postDataAndRender: async function (orders, serviceUrl, reportPath, elementId) {
        try {
            const resp = await fetch('/api/BoldReportsAPI/SetReportData', {
                method: 'POST',
                headers: { 'Content-Type': 'application/json' },
                body: JSON.stringify({ dataSources: orders })
            });
            if (!resp.ok) throw new Error('POST failed: ' + resp.status);
            $("#" + elementId).empty();
            $("#" + elementId).boldReportViewer({
                reportServiceUrl: serviceUrl,
                processingMode: "Local",
                reportPath: reportPath
            });
        } catch (e) {
          throw e;
        }
    }
};
Add the RDLC report
Create a new folder inside the wwwroot folder in your application to store the RDLC reports. Then, add any previously created RDLC reports to this newly created folder or use the below rdlc file.
<?xml version="1.0" encoding="utf-8"?>
<Report xmlns:rd="http://schemas.microsoft.com/SQLServer/reporting/reportdesigner" xmlns="http://schemas.microsoft.com/sqlserver/reporting/2016/01/reportdefinition">
  <AutoRefresh>0</AutoRefresh>
  <ReportSections>
    <ReportSection>
      <Body>
        <ReportItems>
          <Textbox Name="ReportTitle">
            <CanGrow>true</CanGrow>
            <KeepTogether>true</KeepTogether>
            <Paragraphs>
              <Paragraph>
                <TextRuns>
                  <TextRun>
                    <Value>Orders Report</Value>
                    <Style>
                      <FontSize>14pt</FontSize>
                      <FontWeight>Bold</FontWeight>
                    </Style>
                  </TextRun>
                </TextRuns>
                <Style />
              </Paragraph>
            </Paragraphs>
            <Top>0in</Top>
            <Left>0in</Left>
            <Height>0.35in</Height>
            <Width>7.5in</Width>
            <ZIndex>1</ZIndex>
            <Style>
              <TextAlign>Center</TextAlign>
            </Style>
          </Textbox>

          <Tablix Name="OrdersTable">
            <TablixBody>
              <TablixColumns>
                <TablixColumn><Width>1.2in</Width></TablixColumn>
                <TablixColumn><Width>1.8in</Width></TablixColumn>
                <TablixColumn><Width>1.8in</Width></TablixColumn>
                <TablixColumn><Width>1.2in</Width></TablixColumn>
              </TablixColumns>
              <TablixRows>
                <TablixRow>
                  <Height>0.28in</Height>
                  <TablixCells>
                    <TablixCell><CellContents><Textbox Name="Hdr_OrderID"><CanGrow>true</CanGrow><KeepTogether>true</KeepTogether><Paragraphs><Paragraph><TextRuns><TextRun><Value>Order ID</Value><Style><FontWeight>Bold</FontWeight></Style></TextRun></TextRuns><Style /></Paragraph></Paragraphs><Style><BackgroundColor>#F2F2F2</BackgroundColor><Border><Style>Solid</Style></Border><PaddingLeft>4pt</PaddingLeft><PaddingRight>4pt</PaddingRight><PaddingTop>2pt</PaddingTop><PaddingBottom>2pt</PaddingBottom></Style></Textbox></CellContents></TablixCell>
                    <TablixCell><CellContents><Textbox Name="Hdr_CustomerID"><CanGrow>true</CanGrow><KeepTogether>true</KeepTogether><Paragraphs><Paragraph><TextRuns><TextRun><Value>Customer ID</Value><Style><FontWeight>Bold</FontWeight></Style></TextRun></TextRuns><Style /></Paragraph></Paragraphs><Style><BackgroundColor>#F2F2F2</BackgroundColor><Border><Style>Solid</Style></Border><PaddingLeft>4pt</PaddingLeft><PaddingRight>4pt</PaddingRight><PaddingTop>2pt</PaddingTop><PaddingBottom>2pt</PaddingBottom></Style></Textbox></CellContents></TablixCell>
                    <TablixCell><CellContents><Textbox Name="Hdr_OrderDate"><CanGrow>true</CanGrow><KeepTogether>true</KeepTogether><Paragraphs><Paragraph><TextRuns><TextRun><Value>Order Date</Value><Style><FontWeight>Bold</FontWeight></Style></TextRun></TextRuns><Style /></Paragraph></Paragraphs><Style><BackgroundColor>#F2F2F2</BackgroundColor><Border><Style>Solid</Style></Border><PaddingLeft>4pt</PaddingLeft><PaddingRight>4pt</PaddingRight><PaddingTop>2pt</PaddingTop><PaddingBottom>2pt</PaddingBottom></Style></Textbox></CellContents></TablixCell>
                    <TablixCell><CellContents><Textbox Name="Hdr_Freight"><CanGrow>true</CanGrow><KeepTogether>true</KeepTogether><Paragraphs><Paragraph><TextRuns><TextRun><Value>Freight</Value><Style><FontWeight>Bold</FontWeight></Style></TextRun></TextRuns><Style /></Paragraph></Paragraphs><Style><BackgroundColor>#F2F2F2</BackgroundColor><Border><Style>Solid</Style></Border><PaddingLeft>4pt</PaddingLeft><PaddingRight>4pt</PaddingRight><PaddingTop>2pt</PaddingTop><PaddingBottom>2pt</PaddingBottom></Style></Textbox></CellContents></TablixCell>
                  </TablixCells>
                </TablixRow>
                <TablixRow>
                  <Height>0.26in</Height>
                  <TablixCells>
                    <TablixCell><CellContents><Textbox Name="Val_OrderID"><CanGrow>true</CanGrow><KeepTogether>true</KeepTogether><Paragraphs><Paragraph><TextRuns><TextRun><Value>=Fields!OrderID.Value</Value><Style /></TextRun></TextRuns><Style /></Paragraph></Paragraphs><Style><Border><Style>Solid</Style></Border><PaddingLeft>4pt</PaddingLeft><PaddingRight>4pt</PaddingRight><PaddingTop>2pt</PaddingTop><PaddingBottom>2pt</PaddingBottom></Style></Textbox></CellContents></TablixCell>
                    <TablixCell><CellContents><Textbox Name="Val_CustomerID"><CanGrow>true</CanGrow><KeepTogether>true</KeepTogether><Paragraphs><Paragraph><TextRuns><TextRun><Value>=Fields!CustomerID.Value</Value><Style /></TextRun></TextRuns><Style /></Paragraph></Paragraphs><Style><Border><Style>Solid</Style></Border><PaddingLeft>4pt</PaddingLeft><PaddingRight>4pt</PaddingRight><PaddingTop>2pt</PaddingTop><PaddingBottom>2pt</PaddingBottom></Style></Textbox></CellContents></TablixCell>
                    <TablixCell><CellContents><Textbox Name="Val_OrderDate"><CanGrow>true</CanGrow><KeepTogether>true</KeepTogether><Paragraphs><Paragraph><TextRuns><TextRun><Value>=Fields!OrderDate.Value</Value><Style><Format>dd-MMM-yyyy</Format></Style></TextRun></TextRuns><Style /></Paragraph></Paragraphs><Style><Border><Style>Solid</Style></Border><PaddingLeft>4pt</PaddingLeft><PaddingRight>4pt</PaddingRight><PaddingTop>2pt</PaddingTop><PaddingBottom>2pt</PaddingBottom></Style></Textbox></CellContents></TablixCell>
                    <TablixCell><CellContents><Textbox Name="Val_Freight"><CanGrow>true</CanGrow><KeepTogether>true</KeepTogether><Paragraphs><Paragraph><TextRuns><TextRun><Value>=Fields!Freight.Value</Value><Style><Format>C2</Format></Style></TextRun></TextRuns><Style /></Paragraph></Paragraphs><Style><Border><Style>Solid</Style></Border><PaddingLeft>4pt</PaddingLeft><PaddingRight>4pt</PaddingRight><PaddingTop>2pt</PaddingTop><PaddingBottom>2pt</PaddingBottom><TextAlign>Right</TextAlign></Style></Textbox></CellContents></TablixCell>
                  </TablixCells>
                </TablixRow>
              </TablixRows>
            </TablixBody>
            <TablixColumnHierarchy>
              <TablixMembers>
                <TablixMember />
                <TablixMember />
                <TablixMember />
                <TablixMember />
              </TablixMembers>
            </TablixColumnHierarchy>
            <TablixRowHierarchy>
              <TablixMembers>
                <TablixMember>
                  <KeepWithGroup>After</KeepWithGroup>
                  <RepeatOnNewPage>true</RepeatOnNewPage>
                </TablixMember>
                <TablixMember>
                  <Group Name="Detail" />
                </TablixMember>
              </TablixMembers>
            </TablixRowHierarchy>
            <Top>0.5in</Top>
            <Left>0in</Left>
            <Height>0.54in</Height>
            <Width>6.0in</Width>
            <ZIndex>2</ZIndex>
            <DataSetName>OrdersDataSet</DataSetName>
            <Style />
          </Tablix>
        </ReportItems>
        <Height>2in</Height>
        <Style />
      </Body>
      <Width>7.5in</Width>
      <Page>
        <PageHeight>11in</PageHeight>
        <PageWidth>8.5in</PageWidth>
        <LeftMargin>1in</LeftMargin>
        <RightMargin>1in</RightMargin>
        <TopMargin>1in</TopMargin>
        <BottomMargin>1in</BottomMargin>
        <Style />
      </Page>
    </ReportSection>
  </ReportSections>

  <DataSources>
    <DataSource Name="DummyDataSource">
      <ConnectionProperties>
        <DataProvider>System.Data.DataSet</DataProvider>
        <ConnectString>/* Local RDLC Business Object */</ConnectString>
      </ConnectionProperties>
      <rd:DataSourceID>2BA47F3B-787C-4EF9-9A18-FC9405C53C7B</rd:DataSourceID>
    </DataSource>
  </DataSources>

  <DataSets>
    <DataSet Name="OrdersDataSet">
      <Fields>
        <Field Name="OrderID">
          <DataField>OrderID</DataField>
          <rd:TypeName>System.Int32</rd:TypeName>
        </Field>
        <Field Name="CustomerID">
          <DataField>CustomerID</DataField>
          <rd:TypeName>System.String</rd:TypeName>
        </Field>
        <Field Name="OrderDate">
          <DataField>OrderDate</DataField>
          <rd:TypeName>System.DateTime</rd:TypeName>
        </Field>
        <Field Name="Freight">
          <DataField>Freight</DataField>
          <rd:TypeName>System.Double</rd:TypeName>
        </Field>
      </Fields>
      <Query>
        <DataSourceName>DummyDataSource</DataSourceName>
        <CommandText>/* Local RDLC */</CommandText>
      </Query>
    </DataSet>
  </DataSets>

  <rd:ReportUnitType>Inch</rd:ReportUnitType>
  <rd:ReportID>2BA47F3B-787C-4EF9-9A18-FC9405C53C7B</rd:ReportID>
</Report>
Configure the Web API
The Blazor Report Viewer requires a Web API service to process the RDLC report files.
Add Web API Controller
- Right-click the project and select Add > New Item from the context menu.
- In the Add New Item dialog, select API Controller Empty class and name it as
BoldReportsAPIController.cs. - Click Add.
- Open the BoldReportsAPIController and add the following code to implement the Bold Reports
IReportControllerfor handling report requests.
The Report Viewer requires data in a DataSet format. In the following example, API converts the posted DataGrid data (JSON) into a DataSet named OrdersDataSet that matches the RDLC file.
using System.Collections.Generic;
using System.Data;
using System.IO;
using BoldReports.Web; // Added for ReportDataSource & ReportDataSourceCollection
using BoldReports.Web.ReportViewer;
using Microsoft.AspNetCore.Hosting;
using Microsoft.AspNetCore.Mvc;
using Microsoft.Extensions.Caching.Memory;

[ApiController]
[Route("api/[controller]/[action]")]
public class BoldReportsAPIController : Controller, IReportController
{
    private readonly IMemoryCache _cache;
    private readonly IWebHostEnvironment _env;
    private static List<Order>? _sharedOrders;
    private static DataSet? _reportDataSet;
    public BoldReportsAPIController(IMemoryCache cache, IWebHostEnvironment env)
    {
        _cache = cache;
        _env = env;
    }

    [HttpPost]
    public object PostReportAction([FromBody] Dictionary<string, object> json)
        => ReportHelper.ProcessReport(json, this, _cache);

    [HttpPost]
    public object PostFormReportAction()
        => ReportHelper.ProcessReport(null, this, _cache);

    [HttpGet]
    public object GetResource([FromQuery] ReportResource resource)
        => ReportHelper.GetResource(resource, this, _cache);

    [HttpPost]
    public IActionResult SetReportData([FromBody] ReportDataModel dataModel)
    {
        try
        {
            if (dataModel?.DataSources != null && dataModel.DataSources.Count > 0)
            {
                _sharedOrders = dataModel.DataSources;
                // Convert List<Order> to DataSet with DataTable
                DataSet ds = new();
                DataTable dt = new("OrdersDataSet");
                // Add columns matching the RDLC report
                dt.Columns.Add("OrderID", typeof(int));
                dt.Columns.Add("CustomerID", typeof(string));
                dt.Columns.Add("OrderDate", typeof(DateTime));
                dt.Columns.Add("Freight", typeof(double));
                // Add rows from orders
                foreach (var order in _sharedOrders)
                {
                    dt.Rows.Add(order.OrderID, order.CustomerID, order.OrderDate, order.Freight);
                }
                ds.Tables.Add(dt);
                _reportDataSet = ds;
                _cache.Set("ReportDataSet", ds, TimeSpan.FromMinutes(10));
                return Ok(new { success = true, message = "Data set successfully" });
            }
            return BadRequest(new { success = false, message = "No data provided" });
        }
        catch (Exception ex)
        {
           return BadRequest(new { success = false, message = ex.Message });
        }
    }

    [NonAction]
    public void OnInitReportOptions(ReportViewerOptions options)
    {
        try
        {
            options.ReportModel.ProcessingMode = ProcessingMode.Local;
            var path = Path.Combine(_env.WebRootPath, "Reports", "Orders.rdlc");

            if (!System.IO.File.Exists(path))
            {
                throw new FileNotFoundException($"RDLC file not found at: {path}");
            }

            var stream = new MemoryStream();
            using (var fs = System.IO.File.OpenRead(path))
            {
                fs.CopyTo(stream);
            }

            stream.Position = 0;
            options.ReportModel.Stream = stream;
            options.ReportModel.ReportPath = "Orders.rdlc";
        }
        catch (Exception ex)
        {
            System.Console.WriteLine($"[OnInitReportOptions] Error: {ex.Message}");
        }
    }

    [NonAction]
    public void OnReportLoaded(ReportViewerOptions options)
    {
        try
        {
            // Retrieve the DataSet from cache or static variable
            DataSet? ds = null;

            if (_cache.TryGetValue("ReportDataSet", out object? cachedData) && cachedData is DataSet cachedDs)
            {
                ds = cachedDs;
            }
            else if (_reportDataSet != null)
            {
                ds = _reportDataSet;
            }
            if (ds != null && ds.Tables.Contains("OrdersDataSet"))
            {
                var table = ds.Tables["OrdersDataSet"];
                options.ReportModel.DataSources = new ReportDataSourceCollection
                {
                    new ReportDataSource("OrdersDataSet", table)
                };
            }
            else
            {
                System.Console.WriteLine("[OnReportLoaded] No DataSet/Table named 'OrdersDataSet' found");
            }
        }
        catch (Exception ex)
        {
            System.Console.WriteLine($"[OnReportLoaded] Error: {ex.Message}");
        }
    }

    public class ReportDataModel
    {
        public List<Order> DataSources { get; set; } = [];
    }
}
Integrating DataGrid and Report Viewer
Create or update any .razor page (e.g., Pages/Home.razor) to host both the DataGrid and the Report Viewer.
Inject IJSRuntime, render the DataGrid and invoke the JavaScript interop with the Orders.rdlc report and the created BoldReportsAPI URL in the Components/Pages/Index.razor file to visualize the report using the viewer.
@page "/"

@using Syncfusion.Blazor.Grids
@inject IJSRuntime JS
@inject HttpClient Http
@inject NavigationManager Nav

<div class="container mt-5">
    <h2>Orders Data Grid & Bold Reports Integration</h2>

    <SfButton CssClass="e-primary mt-3" IsPrimary="true" OnClick="@OpenReport">
        Open RDLC Report
    </SfButton>

    <SfGrid DataSource="@Orders">
        <GridColumns>
            <GridColumn Field=@nameof(Order.OrderID) HeaderText="Order ID" TextAlign="TextAlign.Right" Width="120"></GridColumn>
            <GridColumn Field=@nameof(Order.CustomerID) HeaderText="Customer ID" Width="150"></GridColumn>
            <GridColumn Field=@nameof(Order.OrderDate) HeaderText="Order Date" Format="d" Type="ColumnType.Date" TextAlign="TextAlign.Right" Width="130"></GridColumn>
            <GridColumn Field=@nameof(Order.Freight) HeaderText="Freight" Format="C2" TextAlign="TextAlign.Right" Width="120"></GridColumn>
        </GridColumns>
    </SfGrid>

    <div id="viewer" style="height:80vh; margin-top:20px;"></div>
</div>

@code{
    public List<Order> Orders { get; set; } = [];

    protected override void OnInitialized()
    {
        Orders = Enumerable.Range(1, 10).Select(x => new Order()
        {
            OrderID = 1000 + x,
            CustomerID = (new string[] { "ALFKI", "ANANTR", "ANTON", "BLONP", "BOLID" })[new Random().Next(5)] ?? "ALFKI",
            Freight = 2 * x,
            OrderDate = DateTime.Now.AddDays(-x),
        }).ToList();
    }

    public async Task OpenReport()
    {
        try
        {
            // Step 1: Send the grid data to the server API
            var dataModel = new { DataSources = Orders };
            var baseUrl = Nav.BaseUri.TrimEnd('/');
            var url = $"{baseUrl}/api/BoldReportsAPI/SetReportData".Replace("//api", "/api");
            var response = await Http.PostAsJsonAsync(url, dataModel);

            // Step 2: Render the viewer with the data
            var viewerOptions = new
            {
                serviceUrl = "/api/BoldReportsAPI",
                reportPath = "Orders.rdlc"
            };
            await JS.InvokeVoidAsync("BoldReports.renderViewer", "viewer", viewerOptions);
        }
        catch (Exception ex)
        {
            Console.WriteLine($"Exception: {ex}");
        }
    }

    public class Order {
        public int? OrderID { get; set; }
        public string? CustomerID { get; set; }
        public DateTime? OrderDate { get; set; }
        public double? Freight { get; set; }
    }
}
Run the application
Press Ctrl+F5 (Windows) or ⌘+F5 (macOS) to launch the application.
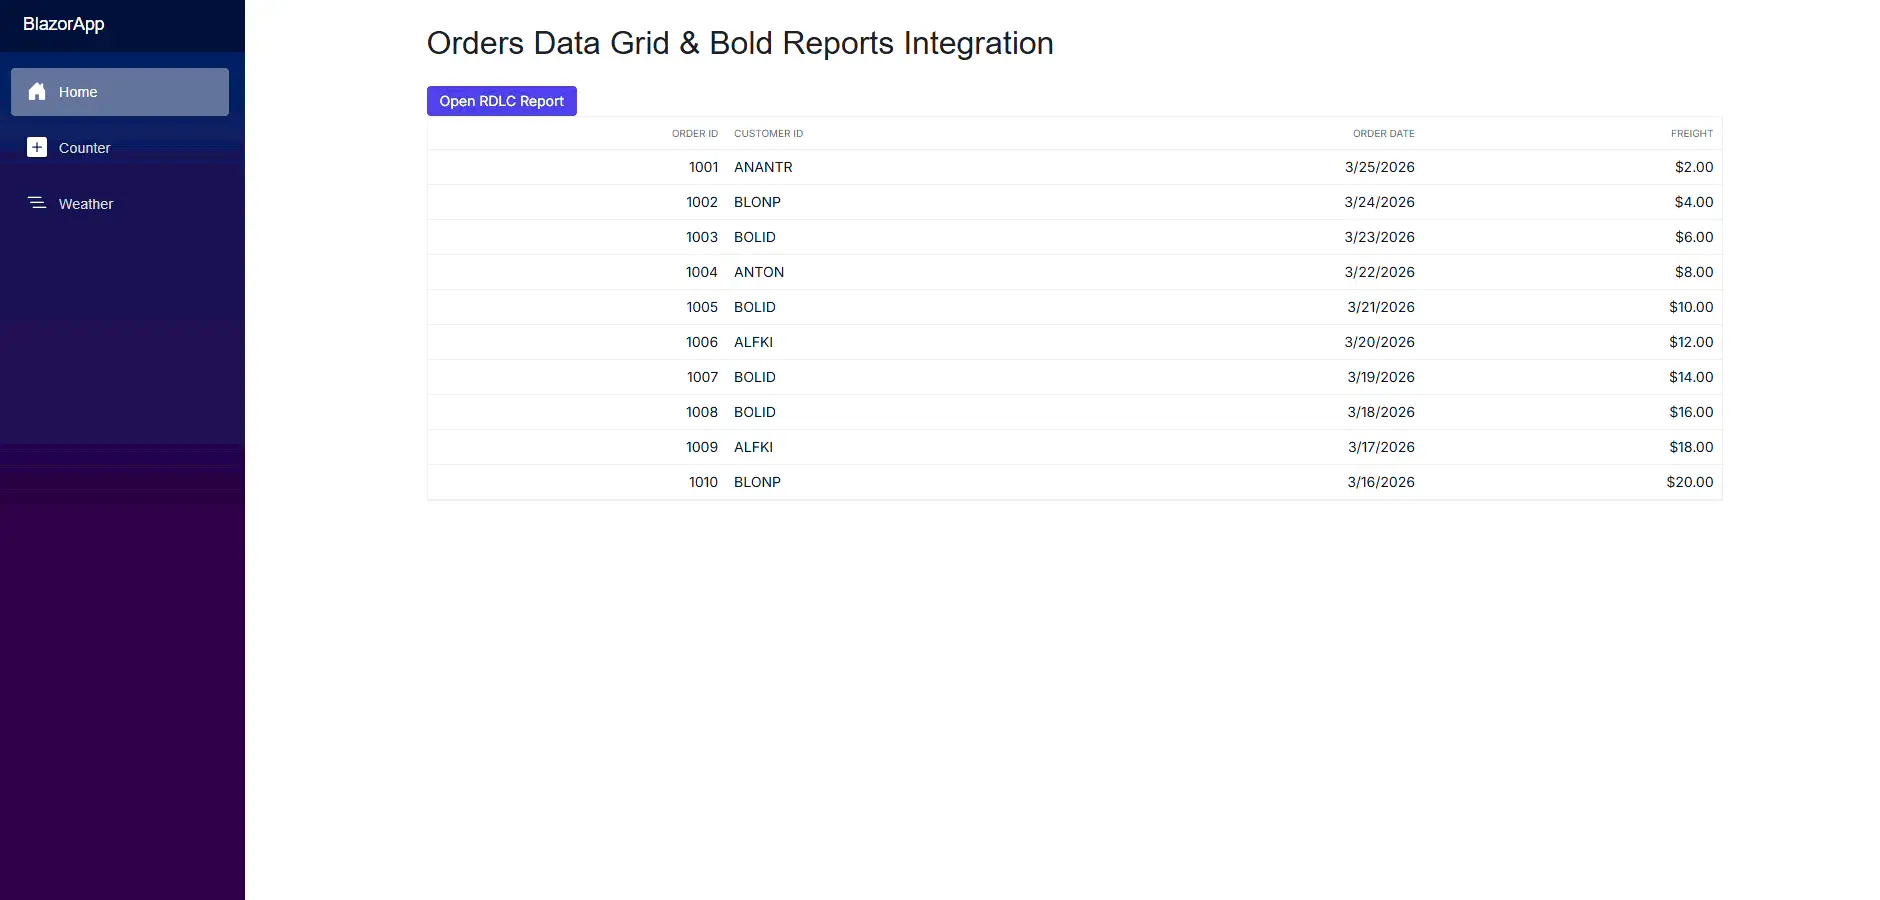
Expected behavior
- DataGrid renders with sample records.
- Clicking Open RDLC Report sends the grid data to the Web API.
- The Bold Report Viewer loads and displays the report.
Output:
Use cases
The integration of the Blazor DataGrid with RDLC reporting enables seamless data interaction and on‑demand report generation within Blazor applications. This combination is ideal for applications that require real‑time reporting based on user‑selected or filtered grid data.
Order processing and invoice generation
Use the DataGrid to display order details such as order ID, customer name, order date, and total amount. Users can sort or filter the records and generate RDLC invoice or order summary reports based on the current DataGrid view. The generated report reflects the selected records, allowing users to preview, print, or export invoices without navigating away from the page.
Inventory management and reporting
Implement an inventory tracking system where product details such as item name, SKU, category, stock quantity, and reorder level are displayed in the DataGrid. Users can filter items based on stock availability and generate RDLC inventory reports or low‑stock summaries. This enables efficient monitoring of inventory status and supports operational and audit requirements.
Customer relationship management(CRM)
Display customer data, sales records, or support interactions in the DataGrid with options for grouping and filtering. Based on the filtered or selected records, users can generate RDLC customer profiles, activity summaries, or sales reports. This helps teams analyze customer data and produce actionable reports directly from the grid.
Financial review and analysis
Use the DataGrid to present financial transactions, expense details, or revenue data with sorting and filtering options by date, category, or department. Users can generate RDLC financial statements or period‑based summaries that match the DataGrid state, ensuring consistency between on‑screen data and exported reports.
Audit and compliance reporting
Create an audit or compliance module where logs, verification records, or inspection results are displayed in the DataGrid. Auditors can filter records by period, status, or department and generate RDLC audit reports or compliance documentation. This simplifies audit workflows and ensures accurate, traceable report generation from validated data.