Getting Started with Blazor Pivot Table in Blazor WASM App
8 Jul 202611 minutes to read
This guide briefly explains how to include the Blazor Pivot Table component in a Blazor WebAssembly App using Visual Studio, Visual Studio Code, and the .NET CLI. Follow these steps to set up and configure the component for your project.
Ready to streamline your Blazor development?
Discover the full potential of Blazor components with AI Coding Assistants. Effortlessly integrate, configure, and enhance your projects with intelligent, context-aware code suggestions, streamlined setups, and real-time insights—all seamlessly integrated into your preferred AI-powered IDEs like VS Code, Cursor, CodeStudio and more. Explore AI Coding Assistants.
Create a new Blazor WebAssembly App
Create a Blazor WebAssembly App using Visual Studio via Microsoft Templates or the Blazor Extension. For detailed instructions, refer to the Blazor WebAssembly App Getting Started documentation.
Run the following command to create a new Blazor WebAssembly App.
dotnet new blazorwasm -o BlazorApp
cd BlazorApp
Alternatively, create a Blazor WebAssembly App using Visual Studio Code via Microsoft Templates, the Blazor Extension, or the C# Dev Kit extension.
Run the following command to create a new Blazor WebAssembly App.
dotnet new blazorwasm -o BlazorApp
cd BlazorApp
Install the required Blazor packages
Install Syncfusion.Blazor.PivotTable and Syncfusion.Blazor.Themes NuGet packages. All Syncfusion Blazor packages are available on nuget.org. See the NuGet packages topic for details.
- Go to Tools → NuGet Package Manager → Manage NuGet Packages for Solution.
- Search the required NuGet packages (
Syncfusion.Blazor.PivotTableandSyncfusion.Blazor.Themes) and install them.
Alternatively, you can install the same packages using the Package Manager Console with the following commands.
Install-Package Syncfusion.Blazor.PivotTable -Version 34.1.29
Install-Package Syncfusion.Blazor.Themes -Version 34.1.29
Open the terminal and run the following commands.
dotnet add package Syncfusion.Blazor.PivotTable -v 34.1.29
dotnet add package Syncfusion.Blazor.Themes -v 34.1.29
Open the command prompt and run the following commands.
dotnet add package Syncfusion.Blazor.PivotTable -v 34.1.29
dotnet add package Syncfusion.Blazor.Themes -v 34.1.29
Add import namespaces
After the packages are installed, open the ~/_Imports.razor file and import the Syncfusion.Blazor and Syncfusion.Blazor.PivotView namespaces.
@using Syncfusion.Blazor
@using Syncfusion.Blazor.PivotView
Register the Blazor service
Open the Program.cs file in the Blazor WebAssembly App and register the Blazor service.
....
using Syncfusion.Blazor;
....
builder.Services.AddSyncfusionBlazor();
....
Add stylesheet and script resources
The theme stylesheet and script can be accessed from NuGet through Static Web Assets. Include the stylesheet and script references in the ~wwwroot/index.html file.
...
<link href="_content/Syncfusion.Blazor.Themes/fluent2.css" rel="stylesheet" />
...
<script src="_content/Syncfusion.Blazor.Core/scripts/syncfusion-blazor.min.js" type="text/javascript"></script>
Add Blazor Pivot Table component
Open a Razor file located in the ~/Pages/*.razor (for example, Home.razor) and add the Blazor Pivot Table component inside the razor file.
Use the SfPivotView component with the specified data type.
@using Syncfusion.Blazor.PivotView

<SfPivotView TValue="ProductDetails" Height="300">
    <PivotViewDataSourceSettings DataSource="@dataSource">
        <PivotViewColumns>
            <PivotViewColumn Name="Year"></PivotViewColumn>
            <PivotViewColumn Name="Quarter"></PivotViewColumn>
        </PivotViewColumns>
        <PivotViewRows>
            <PivotViewRow Name="Country"></PivotViewRow>
            <PivotViewRow Name="Products"></PivotViewRow>
        </PivotViewRows>
        <PivotViewValues>
            <PivotViewValue Name="Sold" Caption="Units Sold"></PivotViewValue>
            <PivotViewValue Name="Amount" Caption="Sold Amount"></PivotViewValue>
        </PivotViewValues>
        <PivotViewFormatSettings>
            <PivotViewFormatSetting Name="Amount" Format="C"></PivotViewFormatSetting>
        </PivotViewFormatSettings>
    </PivotViewDataSourceSettings>
</SfPivotView>

@code {
    public List<ProductDetails> dataSource { get; set; }
    protected override void OnInitialized()
    {
        this.dataSource = ProductDetails.GetProductData().ToList();
    }
}
public class ProductDetails
{
public int Sold { get; set; }
public double Amount { get; set; }
public string Country { get; set; }
public string Products { get; set; }
public string Year { get; set; }
public string Quarter { get; set; }
public static List<ProductDetails> GetProductData()
{
List<ProductDetails> productData = new List<ProductDetails>();
productData.Add(new ProductDetails { Sold = 31, Amount = 52824, Country = "France", Products = "Mountain Bikes", Year = "FY 2022", Quarter = "Q1" });
productData.Add(new ProductDetails { Sold = 51, Amount = 86904, Country = "France", Products = "Mountain Bikes", Year = "FY 2022", Quarter = "Q2" });
productData.Add(new ProductDetails { Sold = 90, Amount = 153360, Country = "France", Products = "Mountain Bikes", Year = "FY 2022", Quarter = "Q3" });
productData.Add(new ProductDetails { Sold = 25, Amount = 42600, Country = "France", Products = "Mountain Bikes", Year = "FY 2022", Quarter = "Q4" });
productData.Add(new ProductDetails { Sold = 16, Amount = 27264, Country = "France", Products = "Mountain Bikes", Year = "FY 2025", Quarter = "Q1" });
productData.Add(new ProductDetails { Sold = 83, Amount = 124422, Country = "France", Products = "Road Bikes", Year = "FY 2022", Quarter = "Q1" });
productData.Add(new ProductDetails { Sold = 51, Amount = 92824, Country = "Germany", Products = "Mountain Bikes", Year = "FY 2022", Quarter = "Q1" });
productData.Add(new ProductDetails { Sold = 97, Amount = 86008, Country = "Germany", Products = "Mountain Bikes", Year = "FY 2023", Quarter = "Q1" });
productData.Add(new ProductDetails { Sold = 15, Amount = 137800, Country = "Germany", Products = "Mountain Bikes", Year = "FY 2024", Quarter = "Q1" });
productData.Add(new ProductDetails { Sold = 96, Amount = 77264, Country = "Germany", Products = "Mountain Bikes", Year = "FY 2025", Quarter = "Q1" });
productData.Add(new ProductDetails { Sold = 23, Amount = 24422, Country = "Germany", Products = "Road Bikes", Year = "FY 2022", Quarter = "Q1" });
productData.Add(new ProductDetails { Sold = 85, Amount = 237800, Country = "United States", Products = "Mountain Bikes", Year = "FY 2024", Quarter = "Q1" });
productData.Add(new ProductDetails { Sold = 76, Amount = 97264, Country = "United States", Products = "Mountain Bikes", Year = "FY 2025", Quarter = "Q1" });
productData.Add(new ProductDetails { Sold = 53, Amount = 94422, Country = "United States", Products = "Road Bikes", Year = "FY 2022", Quarter = "Q1" });
return productData;
}
}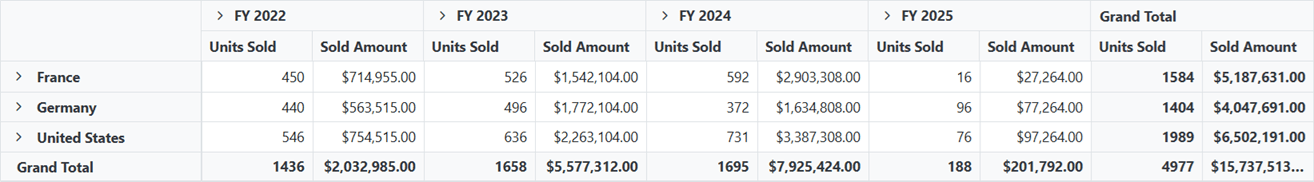
Run the application
Press Ctrl+F5 (Windows) or ⌘+F5 (macOS) to launch the application. The Blazor Pivot Table component will render in your default web browser.
Open the terminal and run the following command.
dotnet runOpen the command prompt and run the following command.
dotnet runNOTE