How can I help you?
Getting Started with Blazor Sankey Diagram in Blazor Server App
3 Dec 202513 minutes to read
This section briefly explains about how to include Blazor Sankey diagram in your Blazor Server App using Visual Studio and Visual Studio Code.
Prerequisites
Create a new Blazor App in Visual Studio
You can create a Blazor Server App using Visual Studio via Microsoft Templates or the Syncfusion® Blazor Extension.
Install Syncfusion® Blazor Sankey NuGet in the App
To add Blazor Sankey Diagram in the app, open the NuGet package manager in Visual Studio (Tools → NuGet Package Manager → Manage NuGet Packages for Solution), search and install Syncfusion.Blazor.Sankey. Alternatively, you can utilize the following package manager command to achieve the same.
Install-Package Syncfusion.Blazor.Sankey -Version 32.2.3NOTE
Syncfusion® Blazor components are available in nuget.org. Refer to NuGet packages topic for available NuGet packages list with component details.
Prerequisites
Create a new Blazor App in Visual Studio Code
You can create a Blazor Server App using Visual Studio Code via Microsoft Templates or the Syncfusion® Blazor Extension.
Alternatively, you can create a Server application using the following command in the terminal(Ctrl+`).
dotnet new blazorserver -o BlazorApp
cd BlazorApp
Install Syncfusion® Blazor Sankey NuGet in the App
- Press Ctrl+` to open the integrated terminal in Visual Studio Code.
- Ensure you’re in the project root directory where your
.csprojfile is located. - Run the following command to install a Syncfusion.Blazor.Sankey NuGet package and ensure all dependencies are installed.
dotnet add package Syncfusion.Blazor.Sankey -v 32.2.3
dotnet restore
NOTE
Syncfusion® Blazor components are available in nuget.org. Refer to NuGet packages topic for available NuGet packages list with component details.
Register Syncfusion® Blazor Service
Open ~/_Imports.razor file and import the Syncfusion.Blazor namespace.
@using Syncfusion.Blazor
@using Syncfusion.Blazor.Sankey
Now, register the Syncfusion® Blazor Service in the ~/Program.cs file of your Blazor Server App.
using Microsoft.AspNetCore.Components;
using Microsoft.AspNetCore.Components.Web;
using Syncfusion.Blazor;

var builder = WebApplication.CreateBuilder(args);

// Add services to the container.
builder.Services.AddRazorPages();
builder.Services.AddServerSideBlazor();
builder.Services.AddSyncfusionBlazor();

var app = builder.Build();
....
Add script resources
The script can be accessed from NuGet through Static Web Assets. Reference the script in the <head> of the main page as follows:
-
For .NET 6 Blazor Server app, include it in ~/Pages/_Layout.cshtml file.
-
For .NET 7 Blazor Server app, include it in the ~/Pages/_Host.cshtml file.
<head>
    ....
    <script src="_content/Syncfusion.Blazor.Core/scripts/syncfusion-blazor.min.js" type="text/javascript"></script>
</head>
NOTE
Check out the Adding Script Reference topic to learn different approaches for adding script references in your Blazor application.
Add Blazor Sankey Diagram
Add the Syncfusion® Blazor Sankey Diagram in the ~/Pages/Index.razor file.
<SfSankey Nodes=@Nodes Links=@Links>

</SfSankey>

@code {
    public List<SankeyDataNode> Nodes = new List<SankeyDataNode>();
    public List<SankeyDataLink> Links = new List<SankeyDataLink>();

    protected override void OnInitialized()
    {
        Nodes = new List<SankeyDataNode>()
        {
            new SankeyDataNode() { Id = "Coffee Production" },
            new SankeyDataNode() { Id = "Arabica" },
            new SankeyDataNode() { Id = "Robusta" },
            new SankeyDataNode() { Id = "Roasted Coffee" },
            new SankeyDataNode() { Id = "Instant Coffee" },
            new SankeyDataNode() { Id = "Green Coffee" },
            new SankeyDataNode() { Id = "North America" },
            new SankeyDataNode() { Id = "Europe" },
            new SankeyDataNode() { Id = "Asia Pacific" },
        };
        Links = new List<SankeyDataLink>()
        {
            new SankeyDataLink() { SourceId = "Coffee Production", TargetId = "Arabica", Value = 95 },
            new SankeyDataLink() { SourceId = "Coffee Production", TargetId = "Robusta", Value = 65 },
            new SankeyDataLink() { SourceId = "Arabica", TargetId = "Roasted Coffee", Value = 60 },
            new SankeyDataLink() { SourceId = "Arabica", TargetId = "Instant Coffee", Value = 20 },
            new SankeyDataLink() { SourceId = "Arabica", TargetId = "Green Coffee", Value = 15 },
            new SankeyDataLink() { SourceId = "Robusta", TargetId = "Roasted Coffee", Value = 30 },
            new SankeyDataLink() { SourceId = "Robusta", TargetId = "Instant Coffee", Value = 25 },
            new SankeyDataLink() { SourceId = "Robusta", TargetId = "Green Coffee", Value = 10 },
            new SankeyDataLink() { SourceId = "Roasted Coffee", TargetId = "North America", Value = 35 },
            new SankeyDataLink() { SourceId = "Roasted Coffee", TargetId = "Europe", Value = 30 },
            new SankeyDataLink() { SourceId = "Roasted Coffee", TargetId = "Asia Pacific", Value = 25 },
            new SankeyDataLink() { SourceId = "Instant Coffee", TargetId = "North America", Value = 15 },
            new SankeyDataLink() { SourceId = "Instant Coffee", TargetId = "Europe", Value = 15 },
            new SankeyDataLink() { SourceId = "Instant Coffee", TargetId = "Asia Pacific", Value = 15 },
            new SankeyDataLink() { SourceId = "Green Coffee", TargetId = "North America", Value = 10 },
            new SankeyDataLink() { SourceId = "Green Coffee", TargetId = "Europe", Value = 8 },
            new SankeyDataLink() { SourceId = "Green Coffee", TargetId = "Asia Pacific", Value = 7 },
        };
        base.OnInitialized();
    }
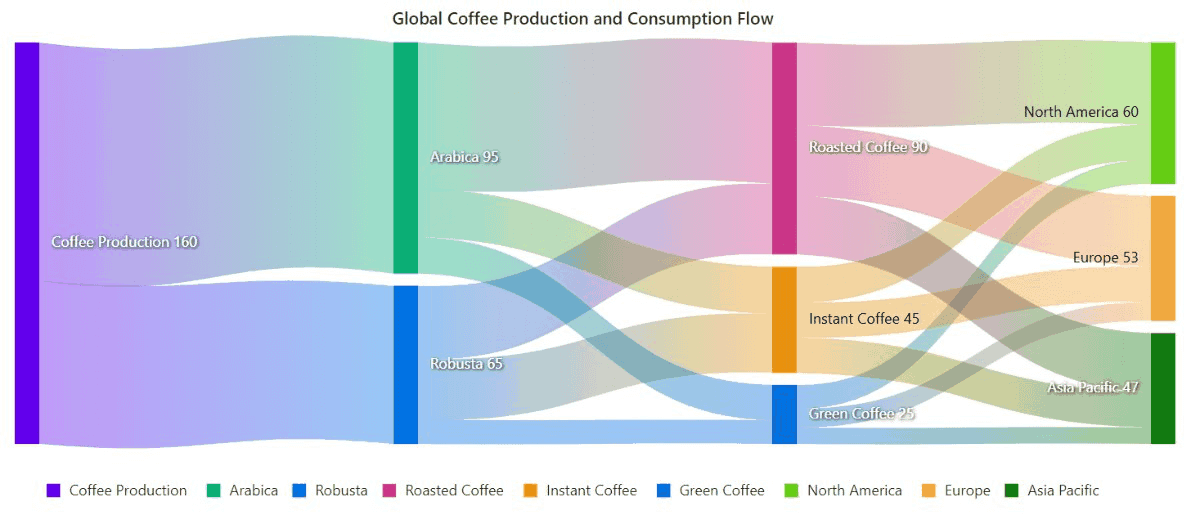
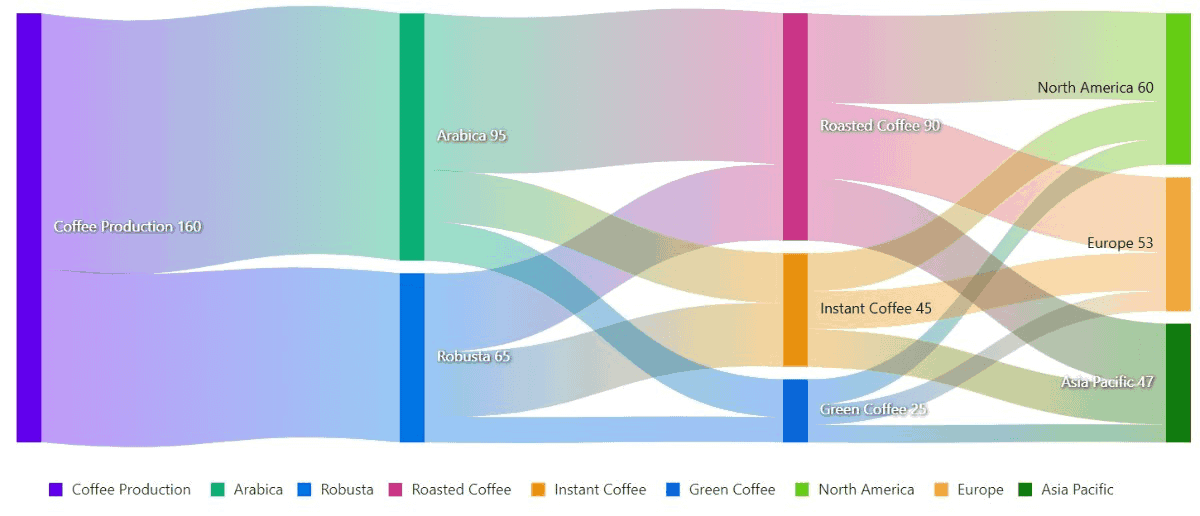
}- Press Ctrl+F5 (Windows) or ⌘+F5 (macOS) to launch the application. This will render the Syncfusion® Blazor Sankey Diagram in your default web browser.
Populate Blazor Sankey Diagram with data
To bind data for the sankey diagram, you can assign an IEnumerable object to the Nodes and Links properties. These properties define the structure of the nodes and the relationships between them.
<SfSankey Nodes=@Nodes Links=@Links>

</SfSankey>

@code {
    public List<SankeyDataNode> Nodes = new List<SankeyDataNode>();
    public List<SankeyDataLink> Links = new List<SankeyDataLink>();

    protected override void OnInitialized()
    {
        Nodes = new List<SankeyDataNode>()
        {
            new SankeyDataNode() { Id = "Coffee Production" },
            new SankeyDataNode() { Id = "Arabica" },
            new SankeyDataNode() { Id = "Robusta" },
            new SankeyDataNode() { Id = "Roasted Coffee" },
            new SankeyDataNode() { Id = "Instant Coffee" },
            new SankeyDataNode() { Id = "Green Coffee" },
            new SankeyDataNode() { Id = "North America" },
            new SankeyDataNode() { Id = "Europe" },
            new SankeyDataNode() { Id = "Asia Pacific" },
        };
        Links = new List<SankeyDataLink>()
        {
            new SankeyDataLink() { SourceId = "Coffee Production", TargetId = "Arabica", Value = 95 },
            new SankeyDataLink() { SourceId = "Coffee Production", TargetId = "Robusta", Value = 65 },
            new SankeyDataLink() { SourceId = "Arabica", TargetId = "Roasted Coffee", Value = 60 },
            new SankeyDataLink() { SourceId = "Arabica", TargetId = "Instant Coffee", Value = 20 },
            new SankeyDataLink() { SourceId = "Arabica", TargetId = "Green Coffee", Value = 15 },
            new SankeyDataLink() { SourceId = "Robusta", TargetId = "Roasted Coffee", Value = 30 },
            new SankeyDataLink() { SourceId = "Robusta", TargetId = "Instant Coffee", Value = 25 },
            new SankeyDataLink() { SourceId = "Robusta", TargetId = "Green Coffee", Value = 10 },
            new SankeyDataLink() { SourceId = "Roasted Coffee", TargetId = "North America", Value = 35 },
            new SankeyDataLink() { SourceId = "Roasted Coffee", TargetId = "Europe", Value = 30 },
            new SankeyDataLink() { SourceId = "Roasted Coffee", TargetId = "Asia Pacific", Value = 25 },
            new SankeyDataLink() { SourceId = "Instant Coffee", TargetId = "North America", Value = 15 },
            new SankeyDataLink() { SourceId = "Instant Coffee", TargetId = "Europe", Value = 15 },
            new SankeyDataLink() { SourceId = "Instant Coffee", TargetId = "Asia Pacific", Value = 15 },
            new SankeyDataLink() { SourceId = "Green Coffee", TargetId = "North America", Value = 10 },
            new SankeyDataLink() { SourceId = "Green Coffee", TargetId = "Europe", Value = 8 },
            new SankeyDataLink() { SourceId = "Green Coffee", TargetId = "Asia Pacific", Value = 7 },
        };
        base.OnInitialized();
    }
}
Add title
Using the Title property, you can add a title to the sankey diagram to provide the user with quick information about the data plotted in the sankey diagram.
<SfSankey Title="Global Coffee Production and Consumption Flow" Nodes=@Nodes Links=@Links>
</SfSankey>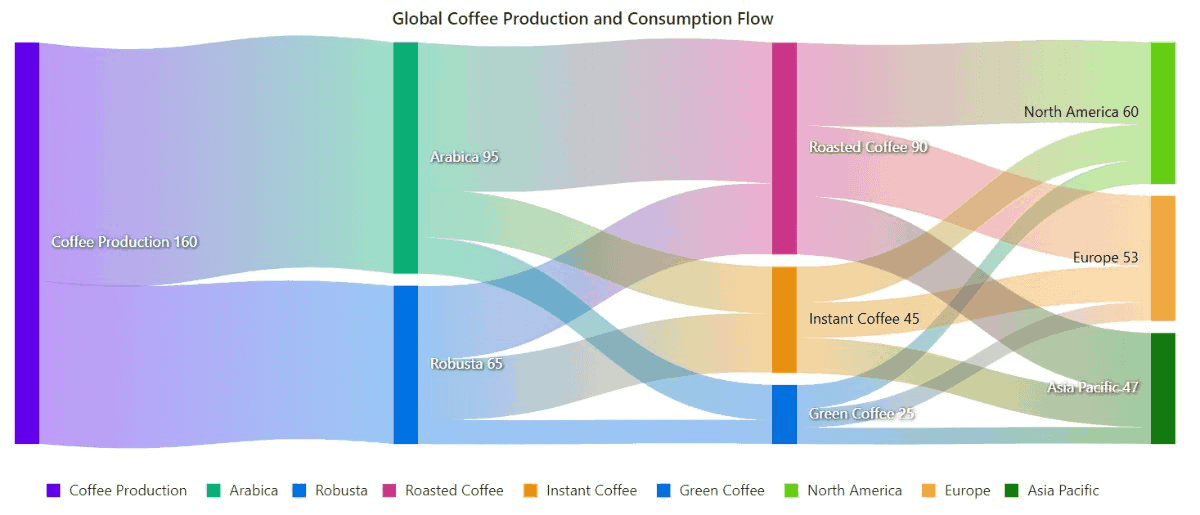
Add node labels
You can add data labels to improve the readability of the sankey diagram. This can be achieved by setting the Visible property to true in the SankeyLabelSettings.
<SfSankey Title="Global Coffee Production and Consumption Flow" Nodes=@Nodes Links=@Links>
    <SankeyLabelSettings Visible="true"></SankeyLabelSettings>
</SfSankey>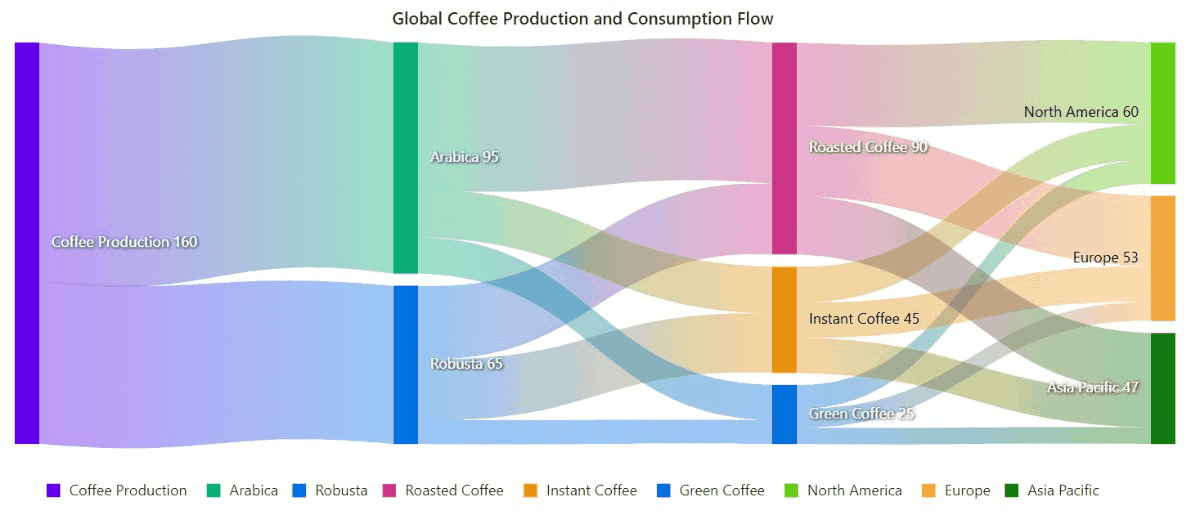
Enable tooltip
The tooltip can be enabled by setting the Enable property in SankeyTooltipSettings to true. However, the tooltip is enabled by default in the sankey diagram.
<SfSankey Title="Global Coffee Production and Consumption Flow" Nodes=@Nodes Links=@Links>
   <SankeyTooltipSettings Enable="true"></SankeyTooltipSettings>
</SfSankey>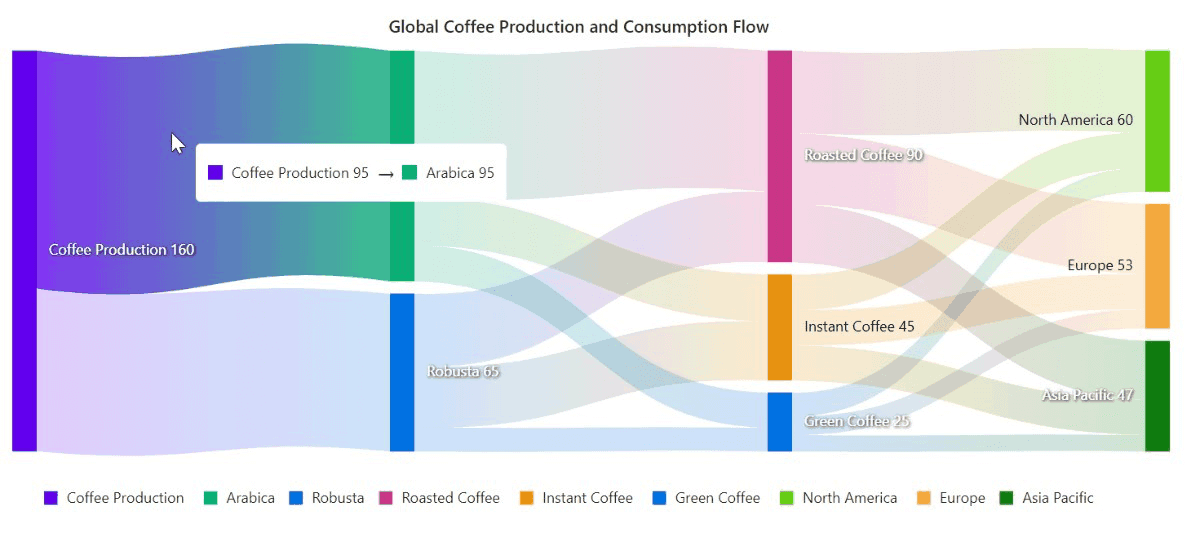
Enable legend
You can use legend for the sankey diagram by setting the Visible property to true in SankeyLegendSettings. However, the legend is enabled by default in the sankey diagram.
<SfSankey Title="Global Coffee Production and Consumption Flow" Nodes=@Nodes Links=@Links>
    <SankeyLegendSettings Visible="true"></SankeyLegendSettings>
</SfSankey>