Labels in Blazor Sankey Diagram
4 Nov 20257 minutes to read
Overview
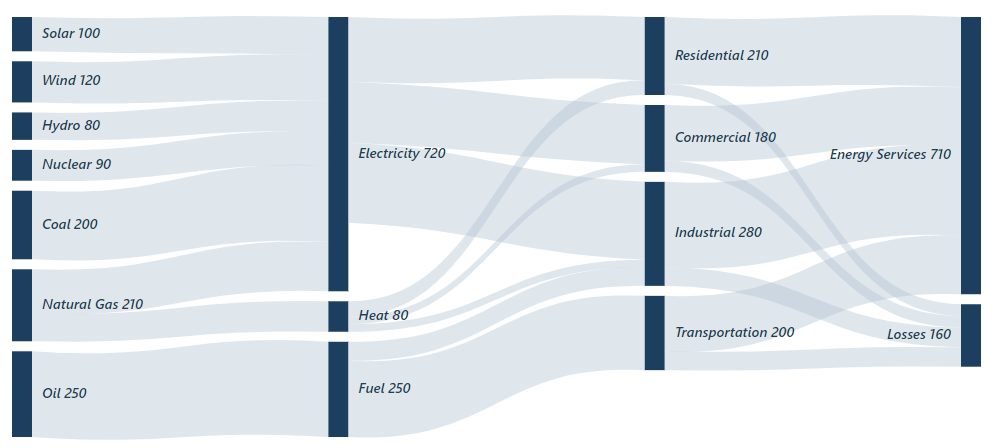
Labels provide textual context for nodes in a Sankey Diagram, improving readability and understanding of data flows. The Blazor Sankey Diagram supports flexible label configuration and styling to meet design and information needs.
Basic Label Configuration
Labels are defined within node settings and further customized using SankeyLabelSettings.
@using Syncfusion.Blazor;
@using Syncfusion.Blazor.Sankey;

<SfSankey Nodes=@Nodes Links=@Links>
    <SankeyNodeSettings Color="#1c3f60" ></SankeyNodeSettings>
    <SankeyLinkSettings Color="#afc1d0" ></SankeyLinkSettings>
    <SankeyLabelSettings Color="#1c3f60" FontWeight="600" FontSize="14px" FontStyle="italic"></SankeyLabelSettings>
    <SankeyLegendSettings Visible="false"></SankeyLegendSettings>
</SfSankey>

@code {
    string _backgroundColor = "#0b1320";
    public List<SankeyDataNode> Nodes = new List<SankeyDataNode>();
    public List<SankeyDataLink> Links = new List<SankeyDataLink>();

    protected override void OnInitialized()
    {
        Nodes = new List<SankeyDataNode>()
        {
            new SankeyDataNode() { Id = "Solar", Label = new SankeyDataLabel() { Text = "Solar" } },
            new SankeyDataNode() { Id = "Wind", Label = new SankeyDataLabel() { Text = "Wind" } },
            new SankeyDataNode() { Id = "Hydro", Label = new SankeyDataLabel() { Text = "Hydro" } },
            new SankeyDataNode() { Id = "Nuclear", Label = new SankeyDataLabel() { Text = "Nuclear" } },
            new SankeyDataNode() { Id = "Coal", Label = new SankeyDataLabel() { Text = "Coal" } },
            new SankeyDataNode() { Id = "Natural Gas", Label = new SankeyDataLabel() { Text = "Natural Gas" } },
            new SankeyDataNode() { Id = "Oil", Label = new SankeyDataLabel() { Text = "Oil" } },
            new SankeyDataNode() { Id = "Electricity", Label = new SankeyDataLabel() { Text = "Electricity" } },
            new SankeyDataNode() { Id = "Heat", Label = new SankeyDataLabel() { Text = "Heat" } },
            new SankeyDataNode() { Id = "Fuel", Label = new SankeyDataLabel() { Text = "Fuel" } },
            new SankeyDataNode() { Id = "Residential", Label = new SankeyDataLabel() { Text = "Residential" } },
            new SankeyDataNode() { Id = "Commercial", Label = new SankeyDataLabel() { Text = "Commercial" } },
            new SankeyDataNode() { Id = "Industrial", Label = new SankeyDataLabel() { Text = "Industrial" } },
            new SankeyDataNode() { Id = "Transportation", Label = new SankeyDataLabel() { Text = "Transportation" } },
            new SankeyDataNode() { Id = "Energy Services", Label = new SankeyDataLabel() { Text = "Energy Services" } },
            new SankeyDataNode() { Id = "Losses", Label = new SankeyDataLabel() { Text = "Losses" } }
        };

        Links = new List<SankeyDataLink>()
        {
            new SankeyDataLink() { SourceId = "Solar", TargetId = "Electricity", Value = 100 },
            new SankeyDataLink() { SourceId = "Wind", TargetId = "Electricity", Value = 120 },
            new SankeyDataLink() { SourceId = "Hydro", TargetId = "Electricity", Value = 80 },
            new SankeyDataLink() { SourceId = "Nuclear", TargetId = "Electricity", Value = 90 },
            new SankeyDataLink() { SourceId = "Coal", TargetId = "Electricity", Value = 200 },
            new SankeyDataLink() { SourceId = "Natural Gas", TargetId = "Electricity", Value = 130 },
            new SankeyDataLink() { SourceId = "Natural Gas", TargetId = "Heat", Value = 80 },
            new SankeyDataLink() { SourceId = "Oil", TargetId = "Fuel", Value = 250 },
            new SankeyDataLink() { SourceId = "Electricity", TargetId = "Residential", Value = 170 },
            new SankeyDataLink() { SourceId = "Electricity", TargetId = "Commercial", Value = 160 },
            new SankeyDataLink() { SourceId = "Electricity", TargetId = "Industrial", Value = 210 },
            new SankeyDataLink() { SourceId = "Heat", TargetId = "Residential", Value = 40 },
            new SankeyDataLink() { SourceId = "Heat", TargetId = "Commercial", Value = 20 },
            new SankeyDataLink() { SourceId = "Heat", TargetId = "Industrial", Value = 20 },
            new SankeyDataLink() { SourceId = "Fuel", TargetId = "Transportation", Value = 200 },
            new SankeyDataLink() { SourceId = "Fuel", TargetId = "Industrial", Value = 50 },
            new SankeyDataLink() { SourceId = "Residential", TargetId = "Energy Services", Value = 180 },
            new SankeyDataLink() { SourceId = "Commercial", TargetId = "Energy Services", Value = 150 },
            new SankeyDataLink() { SourceId = "Industrial", TargetId = "Energy Services", Value = 230 },
            new SankeyDataLink() { SourceId = "Transportation", TargetId = "Energy Services", Value = 150 },
            new SankeyDataLink() { SourceId = "Residential", TargetId = "Losses", Value = 30 },
            new SankeyDataLink() { SourceId = "Commercial", TargetId = "Losses", Value = 30 },
            new SankeyDataLink() { SourceId = "Industrial", TargetId = "Losses", Value = 50 },
            new SankeyDataLink() { SourceId = "Transportation", TargetId = "Losses", Value = 50 }
        };
        base.OnInitialized();
    }
}
This configuration defines labels for each node and applies SankeyLabelSettings for color, weight, size, and style.

Customizing Label Appearance
Customize labels using SankeyLabelSettings to improve clarity and alignment with application design.
- Visible: Shows or hides labels.
- FontSize: Controls label size.
- Color: Sets text color for contrast and theme consistency.
- FontFamily: Applies a specific font family to match typography.
- FontWeight: Sets text weight (for example, 400 for normal, 700 for bold).
- Padding: Adds space around text for better placement.
- FontStyle: Enables styles such as italic.
<SankeyLabelSettings
    Visible="true"
    FontSize="12"
    Color="black"
    FontFamily="Arial"
    FontWeight="400"
    Padding="8">
</SankeyLabelSettings>
Key Considerations
- Keep label text concise and descriptive to avoid clutter.
- Vary font sizes and weights to establish visual hierarchy.
- Ensure sufficient color contrast between text and node background.
- Adjust padding to prevent overlap and ensure precise placement.
- Use the Visible property to manage label density in complex diagrams.
Effective label configuration enhances clarity and supports rapid interpretation of complex flows in Sankey diagrams.