Links in Blazor Sankey Diagram
4 Nov 20258 minutes to read
Overview
Links represent flow between nodes in a Sankey diagram. They visually depict relationships and the quantity transferred between entities or stages. This topic explains how to define, customize, and work with links in the Blazor Sankey Diagram.
Basic Link Configuration
Add links by defining a collection of SankeyDataLink objects. Each link requires a source node, a target node, and a numeric value that represents flow magnitude.
- Each link must include
SourceIdandTargetIdthat match existing node IDs. - The
Valueproperty determines link thickness and indicates the quantity flowing between nodes. - Links are rendered automatically based on node positions and specified values.
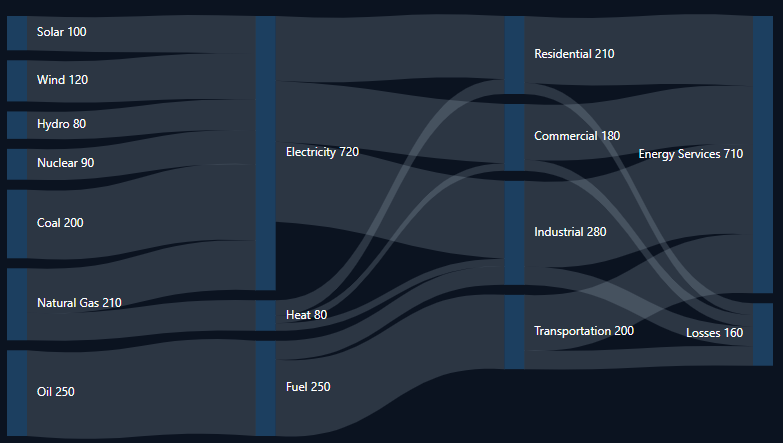
Here is an example of configuring links in the Sankey Diagram:
@using Syncfusion.Blazor;
@using Syncfusion.Blazor.Sankey;

<SfSankey BackgroundColor="@_backgroundColor" Nodes=@Nodes Links=@Links>
    <SankeyNodeSettings Color="#1c3f60" ></SankeyNodeSettings>
    <SankeyLinkSettings Color="#afc1d0" Opacity="0.2"></SankeyLinkSettings>
    <SankeyLabelSettings Color="#FFFFFF" FontWeight="400" ></SankeyLabelSettings>
    <SankeyLegendSettings Visible="false"></SankeyLegendSettings>
</SfSankey>

@code {
    string _backgroundColor = "#0b1320";

    public List<SankeyDataNode> Nodes = new List<SankeyDataNode>();
    public List<SankeyDataLink> Links = new List<SankeyDataLink>();

    protected override void OnInitialized()
    {
        Nodes = new List<SankeyDataNode>()
        {
            new SankeyDataNode() { Id = "Solar", Label = new SankeyDataLabel() { Text = "Solar" } },
            new SankeyDataNode() { Id = "Wind", Label = new SankeyDataLabel() { Text = "Wind" } },
            new SankeyDataNode() { Id = "Hydro", Label = new SankeyDataLabel() { Text = "Hydro" } },
            new SankeyDataNode() { Id = "Nuclear", Label = new SankeyDataLabel() { Text = "Nuclear" } },
            new SankeyDataNode() { Id = "Coal", Label = new SankeyDataLabel() { Text = "Coal" } },
            new SankeyDataNode() { Id = "Natural Gas", Label = new SankeyDataLabel() { Text = "Natural Gas" } },
            new SankeyDataNode() { Id = "Oil", Label = new SankeyDataLabel() { Text = "Oil" } },
            new SankeyDataNode() { Id = "Electricity", Label = new SankeyDataLabel() { Text = "Electricity" } },
            new SankeyDataNode() { Id = "Heat", Label = new SankeyDataLabel() { Text = "Heat" } },
            new SankeyDataNode() { Id = "Fuel", Label = new SankeyDataLabel() { Text = "Fuel" } },
            new SankeyDataNode() { Id = "Residential", Label = new SankeyDataLabel() { Text = "Residential" } },
            new SankeyDataNode() { Id = "Commercial", Label = new SankeyDataLabel() { Text = "Commercial" } },
            new SankeyDataNode() { Id = "Industrial", Label = new SankeyDataLabel() { Text = "Industrial" } },
            new SankeyDataNode() { Id = "Transportation", Label = new SankeyDataLabel() { Text = "Transportation" } },
            new SankeyDataNode() { Id = "Energy Services", Label = new SankeyDataLabel() { Text = "Energy Services" } },
            new SankeyDataNode() { Id = "Losses", Label = new SankeyDataLabel() { Text = "Losses" } }
        };

        Links = new List<SankeyDataLink>()
        {
            // Energy Sources to Carriers
            new SankeyDataLink() { SourceId = "Solar", TargetId = "Electricity", Value = 100 },
            new SankeyDataLink() { SourceId = "Wind", TargetId = "Electricity", Value = 120 },
            new SankeyDataLink() { SourceId = "Hydro", TargetId = "Electricity", Value = 80 },
            new SankeyDataLink() { SourceId = "Nuclear", TargetId = "Electricity", Value = 90 },
            new SankeyDataLink() { SourceId = "Coal", TargetId = "Electricity", Value = 200 },
            new SankeyDataLink() { SourceId = "Natural Gas", TargetId = "Electricity", Value = 130 },
            new SankeyDataLink() { SourceId = "Natural Gas", TargetId = "Heat", Value = 80 },
            new SankeyDataLink() { SourceId = "Oil", TargetId = "Fuel", Value = 250 },

            // Energy Carriers to Sectors
            new SankeyDataLink() { SourceId = "Electricity", TargetId = "Residential", Value = 170 },
            new SankeyDataLink() { SourceId = "Electricity", TargetId = "Commercial", Value = 160 },
            new SankeyDataLink() { SourceId = "Electricity", TargetId = "Industrial", Value = 210 },
            new SankeyDataLink() { SourceId = "Heat", TargetId = "Residential", Value = 40 },
            new SankeyDataLink() { SourceId = "Heat", TargetId = "Commercial", Value = 20 },
            new SankeyDataLink() { SourceId = "Heat", TargetId = "Industrial", Value = 20 },
            new SankeyDataLink() { SourceId = "Fuel", TargetId = "Transportation", Value = 200 },
            new SankeyDataLink() { SourceId = "Fuel", TargetId = "Industrial", Value = 50 },

            // Sectors to End Use and Losses
            new SankeyDataLink() { SourceId = "Residential", TargetId = "Energy Services", Value = 180 },
            new SankeyDataLink() { SourceId = "Commercial", TargetId = "Energy Services", Value = 150 },
            new SankeyDataLink() { SourceId = "Industrial", TargetId = "Energy Services", Value = 230 },
            new SankeyDataLink() { SourceId = "Transportation", TargetId = "Energy Services", Value = 150 },
            new SankeyDataLink() { SourceId = "Residential", TargetId = "Losses", Value = 30 },
            new SankeyDataLink() { SourceId = "Commercial", TargetId = "Losses", Value = 30 },
            new SankeyDataLink() { SourceId = "Industrial", TargetId = "Losses", Value = 50 },
            new SankeyDataLink() { SourceId = "Transportation", TargetId = "Losses", Value = 50 }
        };
        base.OnInitialized();
    }
}
In this example, multiple links connect nodes across sources, energy carriers, and usage sectors.

Customizing Link Appearance
In a Sankey Diagram, links convey the flow of data between nodes. Their appearance is essential for clarity. Configure SankeyLinkSettings to align with design requirements or emphasize specific flows.
-
Color: Sets link color (HEX or RGBA) to distinguish flows. -
ColorType: Controls how color is applied:-
SankeyColorType.Source: Matches the source node color. -
SankeyColorType.Target: Matches the target node color. -
SankeyColorType.Blend: Blends source and target colors as a gradient.
-
-
Opacity: Sets overall link transparency (0.0 – 1.0). The default value is 0.8. -
HighlightOpacity: Opacity on hover for emphasis. The default value is 0.8. -
InactiveOpacity: Opacity for non‑hovered links to minimize visual prominence. The default value is 0.2.
Example configuration:
<SankeyLinkSettings
    Color="blue"
    ColorType="SankeyColorType.Source"
    HighlightOpacity="1"
    InactiveOpacity="0.3"
    Opacity="0.7">
</SankeyLinkSettings>
Key Considerations
- Provide accurate values to reflect real flow magnitudes.
- Adjust link colors and opacities to improve contrast and readability.
- Use
ColorTypeto reinforce flow origin or destination, or to blend both. - Leverage
HighlightOpacityandInactiveOpacityto guide focus during interaction.
Effective link configuration results in informative, visually clear Sankey diagrams that communicate relationships and quantities with precision.