Nodes in Blazor Sankey Diagram
30 Jun 20268 minutes to read
Overview
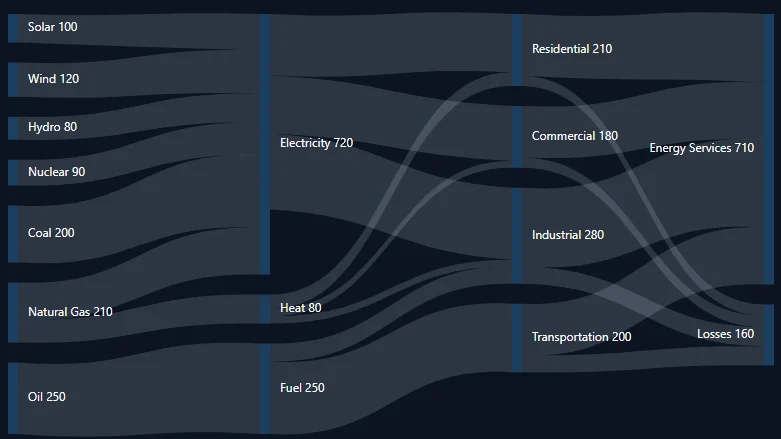
Nodes are fundamental elements in a Sankey Diagram, representing entities or stages in a process flow. This topic describes how to define, customize, and work with nodes in the Blazor Sankey Diagram.
Basic Node Configuration
To add nodes to a Sankey Diagram, define a collection of SankeyDataNode objects. Each node requires a unique identifier and optional properties for display and layout.
- Each node must include a unique
Idproperty. - The
Labelproperty is of typeSankeyDataLabeland specifies the text displayed for the node. - Node positions are determined automatically based on connections defined in the
Linkscollection.
Here is an example of configuring nodes in the Sankey Diagram:
@using Syncfusion.Blazor;
@using Syncfusion.Blazor.Sankey;

<SfSankey BackgroundColor="@_backgroundColor" Nodes=@Nodes Links=@Links>
    <SankeyNodeSettings Color="#1c3f60" Width="10" Padding="20"></SankeyNodeSettings>
    <SankeyLinkSettings Color="#afc1d0" Opacity="0.2"></SankeyLinkSettings>
    <SankeyLabelSettings Color="#FFFFFF" FontWeight="400" ></SankeyLabelSettings>
    <SankeyLegendSettings Visible="false"></SankeyLegendSettings>
</SfSankey>

@code {
    string _backgroundColor = "#0b1320";

    public List<SankeyDataNode> Nodes = new List<SankeyDataNode>();
    public List<SankeyDataLink> Links = new List<SankeyDataLink>();

    protected override void OnInitialized()
    {
        Nodes = new List<SankeyDataNode>()
        {
            new SankeyDataNode() { Id = "Solar", Label = new SankeyDataLabel() { Text = "Solar" } },
            new SankeyDataNode() { Id = "Wind", Label = new SankeyDataLabel() { Text = "Wind" } },
            new SankeyDataNode() { Id = "Hydro", Label = new SankeyDataLabel() { Text = "Hydro" } },
            new SankeyDataNode() { Id = "Nuclear", Label = new SankeyDataLabel() { Text = "Nuclear" } },
            new SankeyDataNode() { Id = "Coal", Label = new SankeyDataLabel() { Text = "Coal" } },
            new SankeyDataNode() { Id = "Natural Gas", Label = new SankeyDataLabel() { Text = "Natural Gas" } },
            new SankeyDataNode() { Id = "Oil", Label = new SankeyDataLabel() { Text = "Oil" } },
            new SankeyDataNode() { Id = "Electricity", Label = new SankeyDataLabel() { Text = "Electricity" } },
            new SankeyDataNode() { Id = "Heat", Label = new SankeyDataLabel() { Text = "Heat" } },
            new SankeyDataNode() { Id = "Fuel", Label = new SankeyDataLabel() { Text = "Fuel" } },
            new SankeyDataNode() { Id = "Residential", Label = new SankeyDataLabel() { Text = "Residential" } },
            new SankeyDataNode() { Id = "Commercial", Label = new SankeyDataLabel() { Text = "Commercial" } },
            new SankeyDataNode() { Id = "Industrial", Label = new SankeyDataLabel() { Text = "Industrial" } },
            new SankeyDataNode() { Id = "Transportation", Label = new SankeyDataLabel() { Text = "Transportation" } },
            new SankeyDataNode() { Id = "Energy Services", Label = new SankeyDataLabel() { Text = "Energy Services" } },
            new SankeyDataNode() { Id = "Losses", Label = new SankeyDataLabel() { Text = "Losses" } }
        };

        Links = new List<SankeyDataLink>()
        {
            // Energy Sources to Carriers
            new SankeyDataLink() { SourceId = "Solar", TargetId = "Electricity", Value = 100 },
            new SankeyDataLink() { SourceId = "Wind", TargetId = "Electricity", Value = 120 },
            new SankeyDataLink() { SourceId = "Hydro", TargetId = "Electricity", Value = 80 },
            new SankeyDataLink() { SourceId = "Nuclear", TargetId = "Electricity", Value = 90 },
            new SankeyDataLink() { SourceId = "Coal", TargetId = "Electricity", Value = 200 },
            new SankeyDataLink() { SourceId = "Natural Gas", TargetId = "Electricity", Value = 130 },
            new SankeyDataLink() { SourceId = "Natural Gas", TargetId = "Heat", Value = 80 },
            new SankeyDataLink() { SourceId = "Oil", TargetId = "Fuel", Value = 250 },

            // Energy Carriers to Sectors
            new SankeyDataLink() { SourceId = "Electricity", TargetId = "Residential", Value = 170 },
            new SankeyDataLink() { SourceId = "Electricity", TargetId = "Commercial", Value = 160 },
            new SankeyDataLink() { SourceId = "Electricity", TargetId = "Industrial", Value = 210 },
            new SankeyDataLink() { SourceId = "Heat", TargetId = "Residential", Value = 40 },
            new SankeyDataLink() { SourceId = "Heat", TargetId = "Commercial", Value = 20 },
            new SankeyDataLink() { SourceId = "Heat", TargetId = "Industrial", Value = 20 },
            new SankeyDataLink() { SourceId = "Fuel", TargetId = "Transportation", Value = 200 },
            new SankeyDataLink() { SourceId = "Fuel", TargetId = "Industrial", Value = 50 },

            // Sectors to End Use and Losses
            new SankeyDataLink() { SourceId = "Residential", TargetId = "Energy Services", Value = 180 },
            new SankeyDataLink() { SourceId = "Commercial", TargetId = "Energy Services", Value = 150 },
            new SankeyDataLink() { SourceId = "Industrial", TargetId = "Energy Services", Value = 230 },
            new SankeyDataLink() { SourceId = "Transportation", TargetId = "Energy Services", Value = 150 },
            new SankeyDataLink() { SourceId = "Residential", TargetId = "Losses", Value = 30 },
            new SankeyDataLink() { SourceId = "Commercial", TargetId = "Losses", Value = 30 },
            new SankeyDataLink() { SourceId = "Industrial", TargetId = "Losses", Value = 50 },
            new SankeyDataLink() { SourceId = "Transportation", TargetId = "Losses", Value = 50 }
        };
        base.OnInitialized();
    }
}
In this example, nodes represent categories such as sources, energy types, and usage groups.
Customizing Node Appearance
Nodes represent the primary entities in a Sankey Diagram, and their appearance can be tailored to improve clarity and style. Using SankeyNodeSettings, properties such as width, alignment, padding, and spacing can be configured to avoid overlap and enhance readability.
-
Width: Sets the node width. The default value is20; increase or decrease to adjust emphasis. -
Alignment: Controls node alignment options:- Left: Aligns nodes to the left edge of the layout.
- Top: Aligns nodes to the top edge of the layout.
- Stretch: Stretches nodes to fill available space.
-
Offset: Applies an additional offset relative to the alignment to fine‑tune placement. -
Padding: Defines spacing around nodes to prevent overlap with other elements. -
Color: Customizes the fill color of nodes (configurable). -
Opacity: Adjusts node transparency (configurable).
Example:
<SankeyNodeSettings
    Width="30"
    Alignment="SankeyNodeAlign.Left"
    Offset="10"
    Padding="10">
</SankeyNodeSettings>
Key Considerations
- Use meaningful IDs and labels to improve diagram readability.
- Adjust node width, padding, and alignment to maintain visual hierarchy and spacing.
- Define links to accurately represent relationships and flow between nodes.
- Leverage
SankeyLinkSettingsandSankeyLabelSettingsto style links and labels consistently.
Mastering node configuration enables creation of rich, informative flow diagrams that communicate complex processes and relationships effectively. The example demonstrates a comprehensive visualization of energy usage patterns across sectors.