How can I help you?
Title and Subtitle in Blazor Sankey Diagram
20 May 202613 minutes to read
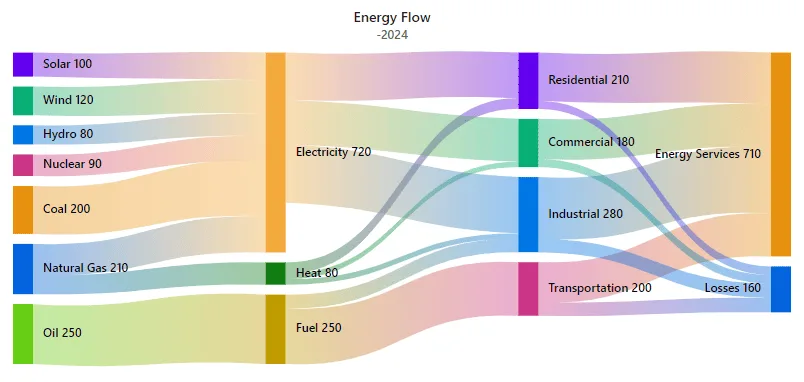
The Syncfusion® Blazor Sankey Diagram supports adding a title and subtitle to provide context and description for the data visualization. This topic explains how to set and customize the title and subtitle in the Sankey Diagram.
Setting the Title and Subtitle
Adding a title and subtitle helps convey purpose and scope. Use the Title property for the primary heading and the SubTitle property for supplemental details such as a time period or region.
@using Syncfusion.Blazor;
@using Syncfusion.Blazor.Sankey;

<SfSankey Nodes=@Nodes Links=@Links Title="Energy Flow" SubTitle="-2024">
</SfSankey>
@code {
    public List<SankeyDataNode> Nodes = new List<SankeyDataNode>();
    public List<SankeyDataLink> Links = new List<SankeyDataLink>();
    protected override void OnInitialized()
    {
        Nodes = new List<SankeyDataNode>()
        {
            new SankeyDataNode() { Id = "Solar", Label = new SankeyDataLabel() { Text = "Solar" } },
            new SankeyDataNode() { Id = "Wind", Label = new SankeyDataLabel() { Text = "Wind" } },
            new SankeyDataNode() { Id = "Hydro", Label = new SankeyDataLabel() { Text = "Hydro" } },
            new SankeyDataNode() { Id = "Nuclear", Label = new SankeyDataLabel() { Text = "Nuclear" } },
            new SankeyDataNode() { Id = "Coal", Label = new SankeyDataLabel() { Text = "Coal" } },
            new SankeyDataNode() { Id = "Natural Gas", Label = new SankeyDataLabel() { Text = "Natural Gas" } },
            new SankeyDataNode() { Id = "Oil", Label = new SankeyDataLabel() { Text = "Oil" } },
            new SankeyDataNode() { Id = "Electricity", Label = new SankeyDataLabel() { Text = "Electricity" } },
            new SankeyDataNode() { Id = "Heat", Label = new SankeyDataLabel() { Text = "Heat" } },
            new SankeyDataNode() { Id = "Fuel", Label = new SankeyDataLabel() { Text = "Fuel" } },
            new SankeyDataNode() { Id = "Residential", Label = new SankeyDataLabel() { Text = "Residential" } },
            new SankeyDataNode() { Id = "Commercial", Label = new SankeyDataLabel() { Text = "Commercial" } },
            new SankeyDataNode() { Id = "Industrial", Label = new SankeyDataLabel() { Text = "Industrial" } },
            new SankeyDataNode() { Id = "Transportation", Label = new SankeyDataLabel() { Text = "Transportation" } },
            new SankeyDataNode() { Id = "Energy Services", Label = new SankeyDataLabel() { Text = "Energy Services" } },
            new SankeyDataNode() { Id = "Losses", Label = new SankeyDataLabel() { Text = "Losses" } }
        };

        Links = new List<SankeyDataLink>()
        {
            // Energy Sources to Carriers
            new SankeyDataLink() { SourceId = "Solar", TargetId = "Electricity", Value = 100 },
            new SankeyDataLink() { SourceId = "Wind", TargetId = "Electricity", Value = 120 },
            new SankeyDataLink() { SourceId = "Hydro", TargetId = "Electricity", Value = 80 },
            new SankeyDataLink() { SourceId = "Nuclear", TargetId = "Electricity", Value = 90 },
            new SankeyDataLink() { SourceId = "Coal", TargetId = "Electricity", Value = 200 },
            new SankeyDataLink() { SourceId = "Natural Gas", TargetId = "Electricity", Value = 130 },
            new SankeyDataLink() { SourceId = "Natural Gas", TargetId = "Heat", Value = 80 },
            new SankeyDataLink() { SourceId = "Oil", TargetId = "Fuel", Value = 250 },

            // Energy Carriers to Sectors
            new SankeyDataLink() { SourceId = "Electricity", TargetId = "Residential", Value = 170 },
            new SankeyDataLink() { SourceId = "Electricity", TargetId = "Commercial", Value = 160 },
            new SankeyDataLink() { SourceId = "Electricity", TargetId = "Industrial", Value = 210 },
            new SankeyDataLink() { SourceId = "Heat", TargetId = "Residential", Value = 40 },
            new SankeyDataLink() { SourceId = "Heat", TargetId = "Commercial", Value = 20 },
            new SankeyDataLink() { SourceId = "Heat", TargetId = "Industrial", Value = 20 },
            new SankeyDataLink() { SourceId = "Fuel", TargetId = "Transportation", Value = 200 },
            new SankeyDataLink() { SourceId = "Fuel", TargetId = "Industrial", Value = 50 },

            // Sectors to End Use and Losses
            new SankeyDataLink() { SourceId = "Residential", TargetId = "Energy Services", Value = 180 },
            new SankeyDataLink() { SourceId = "Commercial", TargetId = "Energy Services", Value = 150 },
            new SankeyDataLink() { SourceId = "Industrial", TargetId = "Energy Services", Value = 230 },
            new SankeyDataLink() { SourceId = "Transportation", TargetId = "Energy Services", Value = 150 },
            new SankeyDataLink() { SourceId = "Residential", TargetId = "Losses", Value = 30 },
            new SankeyDataLink() { SourceId = "Commercial", TargetId = "Losses", Value = 30 },
            new SankeyDataLink() { SourceId = "Industrial", TargetId = "Losses", Value = 50 },
            new SankeyDataLink() { SourceId = "Transportation", TargetId = "Losses", Value = 50 }
        };
        base.OnInitialized();
    }
}
In this example, “Energy Flow” is configured as the title and “-2024” as the subtitle.
Customizing Title and Subtitle
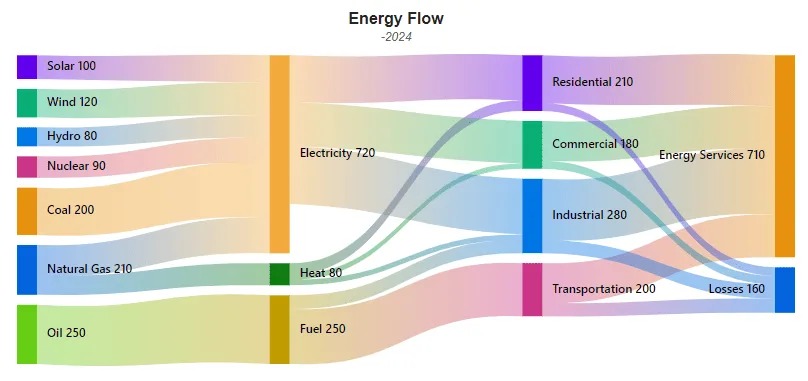
The title and subtitle can be styled using SankeyTitleStyle and SankeySubtitleStyle. Set font properties such as FontFamily, FontSize, FontStyle, and FontWeight to match branding and readability requirements.
@using Syncfusion.Blazor;
@using Syncfusion.Blazor.Sankey;

<SfSankey Nodes=@Nodes Links=@Links Title="Energy Flow" SubTitle="-2024">
    <SankeyTitleStyle FontFamily="Arial, sans-serif" FontSize="16px" FontStyle="Bold" FontWeight="600"></SankeyTitleStyle>
    <SankeySubtitleStyle FontFamily="Arial, sans-serif" FontSize="12px" FontStyle="italic" FontWeight="400"></SankeySubtitleStyle>
    <SankeyLabelSettings Color="#000000" FontWeight="500"></SankeyLabelSettings>
</SfSankey>

@code {
    public List<SankeyDataNode> Nodes = new List<SankeyDataNode>();
    public List<SankeyDataLink> Links = new List<SankeyDataLink>();
    protected override void OnInitialized()
    {
        Nodes = new List<SankeyDataNode>()
        {
            new SankeyDataNode() { Id = "Solar", Label = new SankeyDataLabel() { Text = "Solar" } },
            new SankeyDataNode() { Id = "Wind", Label = new SankeyDataLabel() { Text = "Wind" } },
            new SankeyDataNode() { Id = "Hydro", Label = new SankeyDataLabel() { Text = "Hydro" } },
            new SankeyDataNode() { Id = "Nuclear", Label = new SankeyDataLabel() { Text = "Nuclear" } },
            new SankeyDataNode() { Id = "Coal", Label = new SankeyDataLabel() { Text = "Coal" } },
            new SankeyDataNode() { Id = "Natural Gas", Label = new SankeyDataLabel() { Text = "Natural Gas" } },
            new SankeyDataNode() { Id = "Oil", Label = new SankeyDataLabel() { Text = "Oil" } },
            new SankeyDataNode() { Id = "Electricity", Label = new SankeyDataLabel() { Text = "Electricity" } },
            new SankeyDataNode() { Id = "Heat", Label = new SankeyDataLabel() { Text = "Heat" } },
            new SankeyDataNode() { Id = "Fuel", Label = new SankeyDataLabel() { Text = "Fuel" } },
            new SankeyDataNode() { Id = "Residential", Label = new SankeyDataLabel() { Text = "Residential" } },
            new SankeyDataNode() { Id = "Commercial", Label = new SankeyDataLabel() { Text = "Commercial" } },
            new SankeyDataNode() { Id = "Industrial", Label = new SankeyDataLabel() { Text = "Industrial" } },
            new SankeyDataNode() { Id = "Transportation", Label = new SankeyDataLabel() { Text = "Transportation" } },
            new SankeyDataNode() { Id = "Energy Services", Label = new SankeyDataLabel() { Text = "Energy Services" } },
            new SankeyDataNode() { Id = "Losses", Label = new SankeyDataLabel() { Text = "Losses" } }
        };

        Links = new List<SankeyDataLink>()
        {
            // Energy Sources to Carriers
            new SankeyDataLink() { SourceId = "Solar", TargetId = "Electricity", Value = 100 },
            new SankeyDataLink() { SourceId = "Wind", TargetId = "Electricity", Value = 120 },
            new SankeyDataLink() { SourceId = "Hydro", TargetId = "Electricity", Value = 80 },
            new SankeyDataLink() { SourceId = "Nuclear", TargetId = "Electricity", Value = 90 },
            new SankeyDataLink() { SourceId = "Coal", TargetId = "Electricity", Value = 200 },
            new SankeyDataLink() { SourceId = "Natural Gas", TargetId = "Electricity", Value = 130 },
            new SankeyDataLink() { SourceId = "Natural Gas", TargetId = "Heat", Value = 80 },
            new SankeyDataLink() { SourceId = "Oil", TargetId = "Fuel", Value = 250 },

            // Energy Carriers to Sectors
            new SankeyDataLink() { SourceId = "Electricity", TargetId = "Residential", Value = 170 },
            new SankeyDataLink() { SourceId = "Electricity", TargetId = "Commercial", Value = 160 },
            new SankeyDataLink() { SourceId = "Electricity", TargetId = "Industrial", Value = 210 },
            new SankeyDataLink() { SourceId = "Heat", TargetId = "Residential", Value = 40 },
            new SankeyDataLink() { SourceId = "Heat", TargetId = "Commercial", Value = 20 },
            new SankeyDataLink() { SourceId = "Heat", TargetId = "Industrial", Value = 20 },
            new SankeyDataLink() { SourceId = "Fuel", TargetId = "Transportation", Value = 200 },
            new SankeyDataLink() { SourceId = "Fuel", TargetId = "Industrial", Value = 50 },

            // Sectors to End Use and Losses
            new SankeyDataLink() { SourceId = "Residential", TargetId = "Energy Services", Value = 180 },
            new SankeyDataLink() { SourceId = "Commercial", TargetId = "Energy Services", Value = 150 },
            new SankeyDataLink() { SourceId = "Industrial", TargetId = "Energy Services", Value = 230 },
            new SankeyDataLink() { SourceId = "Transportation", TargetId = "Energy Services", Value = 150 },
            new SankeyDataLink() { SourceId = "Residential", TargetId = "Losses", Value = 30 },
            new SankeyDataLink() { SourceId = "Commercial", TargetId = "Losses", Value = 30 },
            new SankeyDataLink() { SourceId = "Industrial", TargetId = "Losses", Value = 50 },
            new SankeyDataLink() { SourceId = "Transportation", TargetId = "Losses", Value = 50 }
        };
        base.OnInitialized();
    }
}
Key Considerations
- Use concise, descriptive titles to communicate the diagram’s purpose quickly.
- Keep the subtitle brief and focused on contextual details.
- Configure font size, family, weight, and color for legibility without distracting from the diagram.
- Ensure the title and subtitle do not overpower the data visualization.