Blazor Sparkline Charts Getting Started in WASM App
19 Aug 202610 minutes to read
This section briefly explains how to include the Blazor Sparkline Charts component in a Blazor WebAssembly App using Visual Studio, Visual Studio Code, and the .NET CLI.
Create a new Blazor WASM App
Create a Blazor WebAssembly App using Visual Studio via Microsoft Templates or the Syncfusion® Blazor Extension. For detailed instructions, refer to the Blazor WebAssembly App Getting Started documentation.
Run the following command to create a new Blazor WebAssembly App.
dotnet new blazorwasm -o BlazorApp
cd BlazorApp
Alternatively, create a Blazor WebAssembly App using Visual Studio Code via Microsoft Templates, the Syncfusion® Blazor Extension, or the C# Dev Kit extension.
Run the following command to create a new Blazor WebAssembly App.
dotnet new blazorwasm -o BlazorApp
cd BlazorApp
Install the required Blazor package
Install Syncfusion.Blazor.Sparkline NuGet package. All Syncfusion Blazor packages are available on nuget.org. See the NuGet packages topic for details.
- Go to Tools → NuGet Package Manager → Manage NuGet Package for Solution.
- Search the required NuGet package (
Syncfusion.Blazor.Sparkline) and install it.
Alternatively, you can install the same package using the Package Manager Console with the following command.
Install-Package Syncfusion.Blazor.Sparkline -Version 34.2.2Open the terminal and run the following command.
dotnet add package Syncfusion.Blazor.Sparkline -v 34.2.2Open the command prompt and run the following command.
dotnet add package Syncfusion.Blazor.Sparkline -v 34.2.2Add import namespaces
After the package is installed, open the ~/_Imports.razor file and import the Syncfusion.Blazor and Syncfusion.Blazor.Charts namespaces.
@using Syncfusion.Blazor
@using Syncfusion.Blazor.Charts
Register the Blazor service
Open the Program.cs file in Blazor WebAssembly App and register the Blazor service and include the required namespace reference using Syncfusion.Blazor; at the top.
builder.Services.AddSyncfusionBlazor();Add script resources
The script can be accessed from NuGet through Static Web Assets. Include the required script references at the end of the <body> section in the ~wwwroot/index.html file to enable Sparkline Charts functionality.
<script src="_content/Syncfusion.Blazor.Core/scripts/syncfusion-blazor.min.js" type="text/javascript"></script>Add Blazor Sparkline Charts component
Open a Razor file located in the ~/Pages/*.razor (for example, Home.razor) and add the Blazor Sparkline Charts component inside the razor file.
<SfSparkline>

</SfSparkline>
Populate Blazor Sparkline Charts with data
To bind data for the Sparkline Charts component, assign a IEnumerable object to the DataSource property. It can also be provided as an instance of the DataManager.
@code {
    public class WeatherReport
    {
        public string Month { get; set; }
        public double Celsius { get; set; }
    }
    public List<WeatherReport> ClimateData = new List<WeatherReport> {
        new  WeatherReport { Month= "Jan", Celsius= 34 },
        new  WeatherReport { Month= "Feb", Celsius= 36 },
        new  WeatherReport { Month= "Mar", Celsius= 32 },
        new  WeatherReport { Month= "Apr", Celsius= 35 },
        new  WeatherReport { Month= "May", Celsius= 40 },
        new  WeatherReport { Month= "Jun", Celsius= 38 },
        new  WeatherReport { Month= "Jul", Celsius= 33 },
        new  WeatherReport { Month= "Aug", Celsius= 37 },
        new  WeatherReport { Month= "Sep", Celsius= 34 },
        new  WeatherReport { Month= "Oct", Celsius= 31 },
        new  WeatherReport { Month= "Nov", Celsius= 30 },
        new  WeatherReport { Month= "Dec", Celsius= 29}
    };
}
Now map the Month and the Celsius fields from the datasource to XName and YName properties for x-axis and y-axis in the Sparkline Charts and then set the ClimateData to DataSource property. Because the Month field is a value-based category, the ValueType property is used to specify it.
<SfSparkline XName="Month"
             YName="Celsius"
             ValueType="SparklineValueType.Category"
             TValue="WeatherReport"
             DataSource="ClimateData"
             Height="80px"
             Width="150px">
</SfSparkline>
Run the application
Press Ctrl+F5 (Windows) or ⌘+F5 (macOS) to launch the application. The Blazor Sparkline Charts component will render in your default web browser.
Open the terminal and run the following command.
dotnet runOpen the command prompt and run the following command.
dotnet run
Blazor Sparkline Charts types
Change the Sparkline Charts type using the Type property set to Line, Column, WinLoss, Pie or Area. Here, the Sparkline type is set to Area.
<SfSparkline XName="Month"
             YName="Celsius"
             ValueType="SparklineValueType.Category"
             Type="SparklineType.Area"
             TValue="WeatherReport"
             DataSource="ClimateData"
             Height="80px"
             Width="150px">
</SfSparkline>
NOTE
Refer to code block to know about the property value of the ClimateData.
Adding Data Label
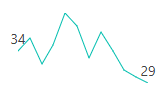
Add the Data Labels to improve the readability of the Sparkline Charts component. This can be achieved by setting the Visible property to true in the SparklineDataLabelSettings.
Available types are:
- Start
- End
- All
- High
- Low
- Negative
<SfSparkline DataSource="ClimateData"
              TValue="WeatherReport"
              XName="Month"
              YName="Celsius"
              ValueType="SparklineValueType.Category"
              Height="80px"
              Width="150px">
    <SparklineDataLabelSettings Visible="new List<VisibleType> { VisibleType.Start, VisibleType.End }"></SparklineDataLabelSettings>
    <SparklinePadding Left="10" Right="10"></SparklinePadding>
</SfSparkline>
NOTE
Refer to the code block to know about the property value of the ClimateData.
Enable tooltip
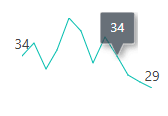
When space constraints prevent from displaying information using Data Labels, the tooltip comes in handy. The tooltip can be enabled by setting the Visible property to true in the SparklineTooltipSettings.
<SfSparkline DataSource="ClimateData"
             TValue="WeatherReport"
             XName="Month"
             YName="Celsius"
             ValueType="SparklineValueType.Category"
             Height="80px"
             Width="150px">
    <SparklineDataLabelSettings Visible="new List<VisibleType> { VisibleType.Start, VisibleType.End }"></SparklineDataLabelSettings>
    <SparklinePadding Left="10" Right="10"></SparklinePadding>
    <SparklineTooltipSettings TValue="WeatherReport" Visible="true"></SparklineTooltipSettings>
</SfSparkline>
NOTE
Refer to the code block to know about the property value of the ClimateData.
NOTE