Getting Started with Blazor Dashboard Layout in Blazor WASM App
27 Aug 202624 minutes to read
This section briefly explains how to include the Blazor Dashboard Layout component in a Blazor WebAssembly App using Visual Studio, Visual Studio Code, and the .NET CLI.
Create a new Blazor WebAssembly (Standalone) App
Create a Blazor WebAssembly App using Visual Studio via Microsoft Templates or the Syncfusion® Blazor Extension.
Run the following command to create a new Blazor WebAssembly App.
dotnet new blazorwasm -o BlazorApp
cd BlazorApp
Alternatively, create a Blazor WebAssembly App using Visual Studio Code via Microsoft Templates or the Syncfusion® Blazor Extension, or the C# Dev Kit extension.
Run the following command to create a new Blazor WebAssembly App.
dotnet new blazorwasm -o BlazorApp
cd BlazorApp
Install the required Blazor packages
Install the Syncfusion.Blazor.Layouts and Syncfusion.Blazor.Themes NuGet packages. All Syncfusion Blazor packages are available on nuget.org. See the NuGet packages topic for details.
- Go to Tools → NuGet Package Manager → Manage NuGet Packages for Solution.
- Search the required NuGet packages (
Syncfusion.Blazor.LayoutsandSyncfusion.Blazor.Themes) and install them.
Alternatively, you can install the same packages using the Package Manager Console with the following commands.
Install-Package Syncfusion.Blazor.Layouts -Version 34.2.2
Install-Package Syncfusion.Blazor.Themes -Version 34.2.2
Open the terminal and run the following commands:
dotnet add package Syncfusion.Blazor.Layouts -v 34.2.2
dotnet add package Syncfusion.Blazor.Themes -v 34.2.2
Open the command prompt and run the following commands:
dotnet add package Syncfusion.Blazor.Layouts -v 34.2.2
dotnet add package Syncfusion.Blazor.Themes -v 34.2.2
Add import namespaces
After the packages are installed, open the ~/_Imports.razor file and import the Syncfusion.Blazor and Syncfusion.Blazor.Layouts namespaces.
@using Syncfusion.Blazor
@using Syncfusion.Blazor.Layouts
Register the Blazor service
Open the Program.cs file in Blazor WebAssembly App and register the Blazor service and include the required namespace reference using Syncfusion.Blazor; at the top.
builder.Services.AddSyncfusionBlazor();Add stylesheet and script resources
The theme stylesheet and script can be accessed from NuGet through Static Web Assets. Include the stylesheet at the end of the <head> section in the ~wwwroot/index.html file.
<link href="_content/Syncfusion.Blazor.Themes/fluent2.css" rel="stylesheet" />Include the required script references at the end of the <body> section in the ~wwwroot/index.html file to enable Blazor Dashboard Layout functionality.
<script src="_content/Syncfusion.Blazor.Core/scripts/syncfusion-blazor.min.js" type="text/javascript"></script>Add Blazor Dashboard Layout component
Open a Razor file located in the ~/Pages/*.razor (for example, Home.razor) and add the Blazor Dashboard Layout component inside the razor file.
@using Syncfusion.Blazor.Layouts

<SfDashboardLayout>
    <DashboardLayoutPanels>
        <DashboardLayoutPanel>
        </DashboardLayoutPanel>
    </DashboardLayoutPanels>
</SfDashboardLayout>
NOTE
There is no need to assign default value for panels. Refer to the Panels section to learn about default value.
Run the application
Press Ctrl+F5 (Windows) or ⌘+F5 (macOS) to launch the application. The Blazor Dashboard Layout component will render in your default web browser.
Open the terminal and run the following command.
dotnet runOpen the command prompt and run the following command.
dotnet run
NOTE
Defining Panels
The Blazor Dashboard Layout component renders multiple panels, each designed using basic properties. Each panel consists of two sections: a header and a content section. These are defined using the HeaderTemplate and ContentTemplate properties, respectively.
Panels are interactive, supporting functionalities such as dragging, floating, and resizing.
[!IMPORTANT]
Each DashboardLayoutPanel must have a uniqueIDvalue. The Blazor Dashboard Layout component uses theIDproperty internally to identify and manage panel state and position. Using duplicate IDs can cause panels to overlap or render in the same location.For more information, refer to the FAQ on preventing panel overlap.
Panels with Simple Data
A basic Blazor Dashboard Layout panel can display simple data. The panel’s header is defined by HeaderTemplate, and its content by the ContentTemplate.
@using Syncfusion.Blazor.Layouts

<SfDashboardLayout>
    <DashboardLayoutPanels>
        <DashboardLayoutPanel>
            <HeaderTemplate><div>Panel 1</div></HeaderTemplate>
            <ContentTemplate><div>Content</div></ContentTemplate>
        </DashboardLayoutPanel>
    </DashboardLayoutPanels>
</SfDashboardLayout>

<style>
    .e-panel-header {
        background-color: rgba(0, 0, 0, .1);
        text-align: center;
    }
    .e-panel-content {
        text-align: center;
        margin-top: 10px;
    }
</style>
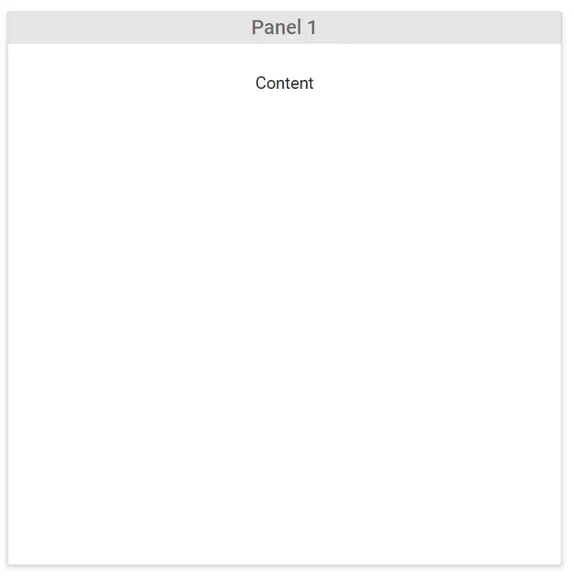
The Blazor Dashboard Layout with simple content will be rendered in the web browser as demonstrated in the following screenshot.
Panels with Components
A Blazor Dashboard Layout can also host complex UI components such as charts, grids, maps, or gauges within its panels.
Install the required Blazor packages for Panels with Components
Install the Syncfusion.Blazor.Charts, Syncfusion.Blazor.Grid, and Syncfusion.Blazor.RangeNavigator NuGet packages. All Syncfusion Blazor packages are available on nuget.org. See the NuGet packages topic for details.
- Go to Tools → NuGet Package Manager → Manage NuGet Packages for Solution.
- Search the required NuGet packages (
Syncfusion.Blazor.Charts,Syncfusion.Blazor.Grid, andSyncfusion.Blazor.RangeNavigator) and install them.
Alternatively, you can install the same packages using the Package Manager Console with the following commands.
Install-Package Syncfusion.Blazor.Charts -Version 34.2.2
Install-Package Syncfusion.Blazor.Grid -Version 34.2.2
Install-Package Syncfusion.Blazor.RangeNavigator -Version 34.2.2
Open the terminal and run the following commands:
dotnet add package Syncfusion.Blazor.Charts -v 34.2.2
dotnet add package Syncfusion.Blazor.Grid -v 34.2.2
dotnet add package Syncfusion.Blazor.RangeNavigator -v 34.2.2
Open the command prompt and run the following commands:
dotnet add package Syncfusion.Blazor.Charts -v 34.2.2
dotnet add package Syncfusion.Blazor.Grid -v 34.2.2
dotnet add package Syncfusion.Blazor.RangeNavigator -v 34.2.2
Add import namespaces for Panels with Components
After the packages are installed, open the ~/_Imports.razor file and import the Syncfusion.Blazor.Charts and Syncfusion.Blazor.Grids namespaces.
@using Syncfusion.Blazor.Charts
@using Syncfusion.Blazor.Grids
These components are placed as panel content by assigning the corresponding Blazor component element as the ContentTemplate of the panel.
@using Syncfusion.Blazor.Charts
@using Syncfusion.Blazor.Grids
@using Syncfusion.Blazor.Layouts

<div class="content">
    <SfDashboardLayout Columns="6" CellSpacing="@(new double[]{10 ,10 })">
        <DashboardLayoutPanels>
            <DashboardLayoutPanel Id="Panel1" SizeX="4" SizeY="2">
                <HeaderTemplate><div class='header'> Customers Count </div></HeaderTemplate>
                <ContentTemplate>
                    <div style="height:100%; width:100%;">
                        <SfChart ID="linechart" @ref="linechartObj">
                            <ChartPrimaryXAxis ValueType="Syncfusion.Blazor.Charts.ValueType.DateTime">
                            </ChartPrimaryXAxis>
                            <ChartSeriesCollection>
                                <ChartSeries DataSource="@DataSource" XName="XValue" YName="YValue" Type="ChartSeriesType.Line">
                                    <ChartMarker Visible="true">
                                        <ChartDataLabel Visible="true" Position="Syncfusion.Blazor.Charts.LabelPosition.Top">
                                        </ChartDataLabel>
                                    </ChartMarker>
                                </ChartSeries>
                            </ChartSeriesCollection>
                        </SfChart>
                    </div>
                </ContentTemplate>
            </DashboardLayoutPanel>
            <DashboardLayoutPanel Id="Panel2" SizeX="2" SizeY="2" Column="4">
                <HeaderTemplate><div class='header'> Product sales in Years </div></HeaderTemplate>
                <ContentTemplate>
                    <div style="height:100%; width:100%;">
                        <SfRangeNavigator ID="range" @ref="rangeObj" Value="@Value" ValueType="Syncfusion.Blazor.Charts.RangeValueType.DateTime" IntervalType="RangeIntervalType.Years" LabelFormat="yyyy">
                            <RangeNavigatorSeriesCollection>
                                <RangeNavigatorSeries DataSource="@DataSource" XName="XValue" Type="RangeNavigatorType.Area" YName="YValue"></RangeNavigatorSeries>
                            </RangeNavigatorSeriesCollection>
                        </SfRangeNavigator>
                    </div>
                </ContentTemplate>
            </DashboardLayoutPanel>
            <DashboardLayoutPanel Id="Panel3" SizeX="3" SizeY="2" Row=2 Column=3>
                <HeaderTemplate><div class='header'> Sales Ratio in Countries </div></HeaderTemplate>
                <ContentTemplate>
                    <div style="height:100%; width:100%;">
                        <SfChart ID="chart" @ref="barchartObj">
                            <ChartPrimaryXAxis Title="Country" EnableTrim="true" ValueType="Syncfusion.Blazor.Charts.ValueType.Category">
                                <ChartAxisMajorGridLines Width="0"></ChartAxisMajorGridLines>
                            </ChartPrimaryXAxis>
                            <ChartSeriesCollection>
                                <ChartSeries DataSource="@DataSource" XName="X" YName="Y" Type="ChartSeriesType.Bar">
                                </ChartSeries>
                            </ChartSeriesCollection>
                        </SfChart>
                    </div>

                </ContentTemplate>
            </DashboardLayoutPanel>
            <DashboardLayoutPanel Id="Panel4" SizeX=3 SizeY=2 Row=2 Column=0>
                <HeaderTemplate><div class='header'> Sales Comparison in Products  </div></HeaderTemplate>
                <ContentTemplate>
                    <div style="height:100%; width:100%;">
                        <SfChart ID="chart1" @ref="chartObj" Width="100%" Height="100%">
                            <ChartPrimaryXAxis ValueType="Syncfusion.Blazor.Charts.ValueType.Category"></ChartPrimaryXAxis>
                            <ChartSeriesCollection>
                                <ChartSeries DataSource="@DataSource" Name="Editors" XName="X1" YName="YValue" Type="ChartSeriesType.StackingColumn">
                                </ChartSeries>
                                <ChartSeries DataSource="@DataSource" Name="Layouts" XName="X1" YName="YValue" Type="ChartSeriesType.StackingColumn">
                                </ChartSeries>
                                <ChartSeries DataSource="@DataSource" Name="Grids" XName="X1" YName="YValue" Type="ChartSeriesType.StackingColumn">
                                </ChartSeries>
                            </ChartSeriesCollection>
                        </SfChart>
                    </div>
                </ContentTemplate>
            </DashboardLayoutPanel>
            <DashboardLayoutPanel Id="Panel5" SizeX=6 SizeY=2 Column=6 Row=4>
                <HeaderTemplate><div class='header'> Top Customers Details</div></HeaderTemplate>
                <ContentTemplate>
                    <div style="height:100%; width:100%;">
                        <SfGrid ID="grid" DataSource="@Orders">
                            <GridPageSettings></GridPageSettings>
                            <GridColumns>
                                <GridColumn Field=@nameof(Order.OrderID) HeaderText="Order ID" TextAlign="Syncfusion.Blazor.Grids.TextAlign.Right" Width="120"></GridColumn>
                                <GridColumn Field=@nameof(Order.CustomerID) HeaderText="Customer Name" Width="130"></GridColumn>
                                <GridColumn Field=@nameof(Order.OrderDate) HeaderText=" Order Date" Format="d" Type="ColumnType.Date" TextAlign="Syncfusion.Blazor.Grids.TextAlign.Right" Width="150"></GridColumn>
                                <GridColumn Field=@nameof(Order.Freight) HeaderText="Freight" Format="C2" TextAlign="Syncfusion.Blazor.Grids.TextAlign.Right" Width="120"></GridColumn>
                            </GridColumns>
                        </SfGrid>
                    </div>
                </ContentTemplate>
            </DashboardLayoutPanel>
        </DashboardLayoutPanels>
    </SfDashboardLayout>
</div>
@code
 {
    SfChart chartObj;
    SfChart barchartObj;
    SfRangeNavigator rangeObj;
    SfChart linechartObj;
    private object[] Value = new object[] { new DateTime(2006, 01, 01), new DateTime(2008, 01, 01) };
    public class ChartData
    {
        public DateTime XValue { get; set; }
        public double YValue { get; set; }
        public string X { get; set; }
        public double Y { get; set; }
        public string Country { get; set; }
        public string X1 { get; set; }
        public double Y1 { get; set; }
        public double Y2 { get; set; }
        public double Y3 { get; set; }
        public double Y4 { get; set; }
    }
    public List<ChartData> DataSource = new List<ChartData>
    {
        new ChartData { XValue = new DateTime(2005, 01, 01), YValue = 21, X = "USA", Y =300.2, Country = "USA: 72", X1= "2012"},
        new ChartData { XValue = new DateTime(2006, 01, 01), YValue = 24, X = "Russia", Y = 103.1, Country = "RUS: 103.1", X1= "2013"},
        new ChartData { XValue = new DateTime(2007, 01, 01), YValue = 36, X = "Brazil", Y = 139.1, Country = "BRZ: 139.1", X1= "2014"},
        new ChartData { XValue = new DateTime(2008, 01, 01), YValue = 38, X = "India", Y = 262.1, Country = "IND: 262.1", X1= "2015"},
        };
    public List<Order> Orders { get; set; }

    protected override void OnInitialized()
    {
        Orders = Enumerable.Range(1, 6).Select(x => new Order()
        {
            OrderID = 1000 + x,
            CustomerID = (new string[] { "ALFKI", "ANANTR", "ANTON", "BLONP", "BOLID" })[new Random().Next(5)],
            Freight = 2.1 * x,
            OrderDate = DateTime.Now.AddDays(-x),
        }).ToList();
    }

    public class Order
    {
        public int? OrderID { get; set; }
        public string CustomerID { get; set; }
        public DateTime? OrderDate { get; set; }
        public double? Freight { get; set; }
    }
    protected override async Task OnAfterRenderAsync(bool firstRender)
    {
        await Task.Delay(3000); // simulate the async operations
        this.chartObj.RefreshAsync();
        this.linechartObj.RefreshAsync();
        this.barchartObj.RefreshAsync();
    }
 }

<style>
    #linechart, #grid, #chart1, #chart, #range {
        height: 100% !important;
        width: 100% !important;
    }
</style>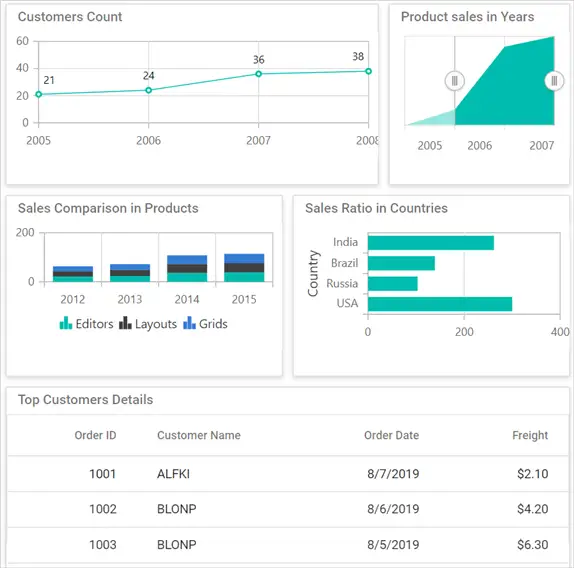
Currently, when Chart components are hosted inside Blazor Dashboard Layout panels, call
RefreshAsync()after the layout has completed rendering or when panel resizing is finished. This ensures the chart recalculates its dimensions based on the final container size.
To get started quickly with designing a Blazor Dashboard Layout with UI Components, you can check the video below.
By default, the Blazor Dashboard Layout component is rendered with auto-adjustable and responsive panels according to the parent dimensions.