Internationalization in Blazor Charts Component
18 Jun 20262 minutes to read
Internationalization is the process of designing and developing a component that can be easily adapted for users from any culture, region, or language. Below elements in the Chart display content based on the internationalization configuration.
- Data label.
- Axis label.
- Tooltip.
Globalization
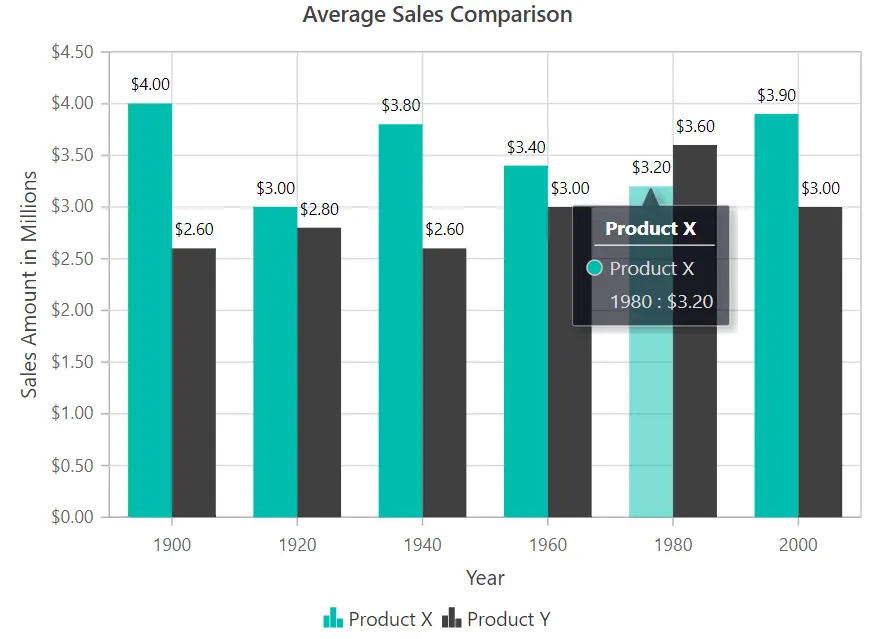
LabelFormat property in axis is used to globalize the number, date and time value of the elements such as Axis label, Data label, and Tooltip in the Chart component.
In the below example, axis, point and tooltip labels are globalized to EUR.
@using Syncfusion.Blazor.Charts

<SfChart Title="Average Sales Comparison">
    <ChartPrimaryXAxis Title="Year"></ChartPrimaryXAxis>

    <ChartPrimaryYAxis LabelFormat="c" Title="Sales Amount in Millions">
    </ChartPrimaryYAxis>

    <ChartTooltipSettings Enable="true" Format="${series.name} <br>${point.x} : ${point.y}">
    </ChartTooltipSettings>

    <ChartSeriesCollection>
        <ChartSeries DataSource="@SalesReports" XName="X" YName="Y" Type="ChartSeriesType.Column" Name="Product X">
            <ChartMarker>
                <ChartDataLabel Visible="true"></ChartDataLabel>
            </ChartMarker>
        </ChartSeries>
        <ChartSeries DataSource="@SalesReports" XName="X" YName="Y1" Type="ChartSeriesType.Column" Name="Product Y">
            <ChartMarker>
                <ChartDataLabel Visible="true"></ChartDataLabel>
            </ChartMarker>
        </ChartSeries>
    </ChartSeriesCollection>
</SfChart>

@code{
    public class ChartData
    {
        public double X { get; set; }
        public double Y { get; set; }
        public double Y1 { get; set; }
    }

    public List<ChartData> SalesReports = new List<ChartData>
	{
        new ChartData {X= 1900, Y= 4, Y1= 2.6 },
        new ChartData{ X= 1920, Y= 3.0, Y1= 2.8 },
        new ChartData{ X= 1940, Y= 3.8, Y1= 2.6},
        new ChartData{ X= 1960, Y= 3.4, Y1= 3 },
        new ChartData{ X= 1980, Y= 3.2, Y1= 3.6 },
        new ChartData{ X= 2000, Y= 3.9, Y1= 3 }
    };
}
Label format
Learn more about axis label format in-relation to axis types from the pages below.
NOTE
Refer to the Blazor Charts feature tour page for its groundbreaking feature representations and also explore the Blazor Chart Example to know various chart types and how to represent time-dependent data, showing trends at equal intervals.